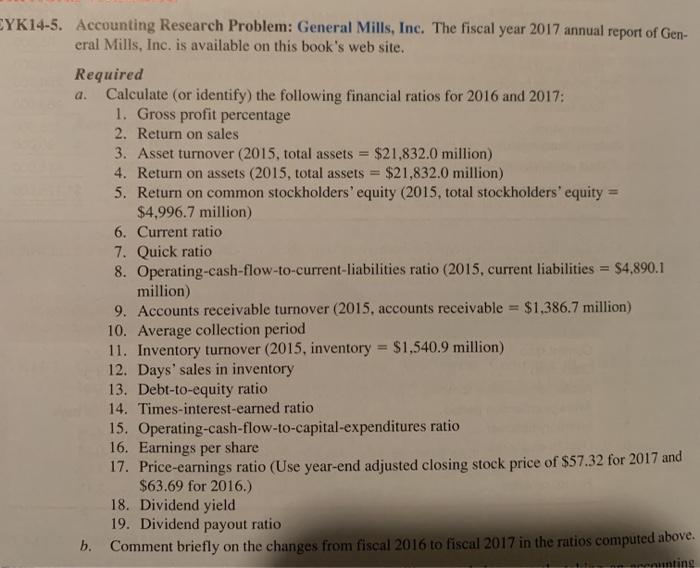
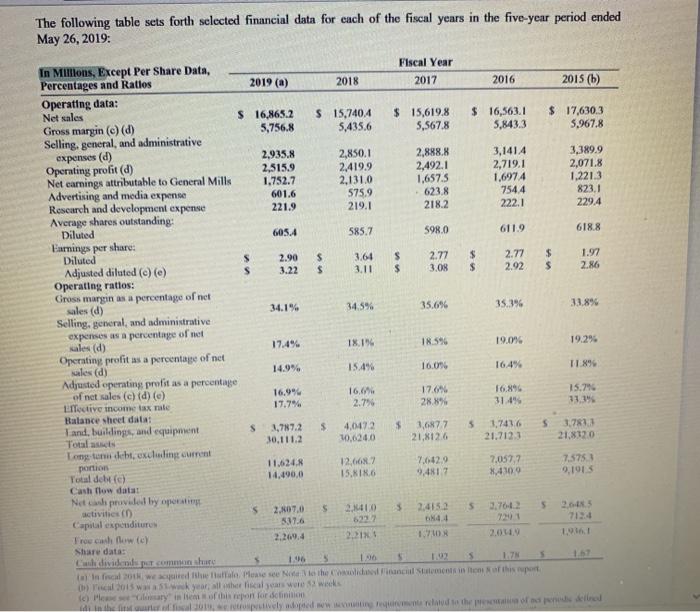
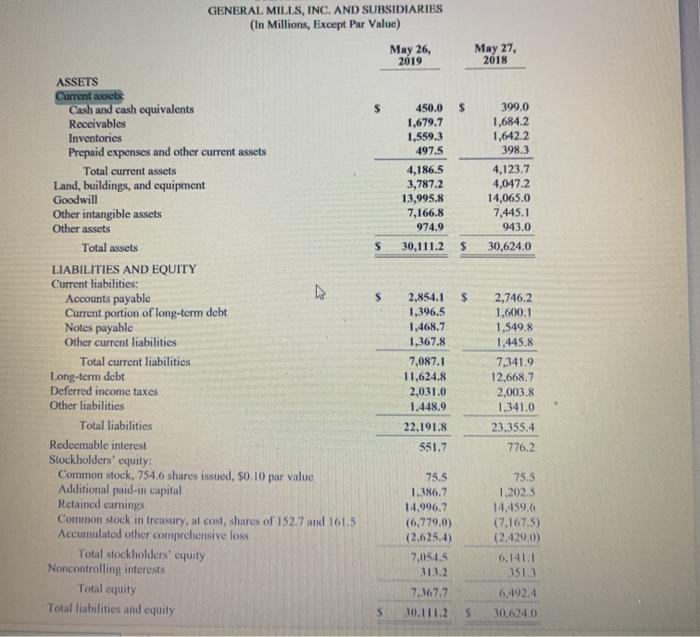
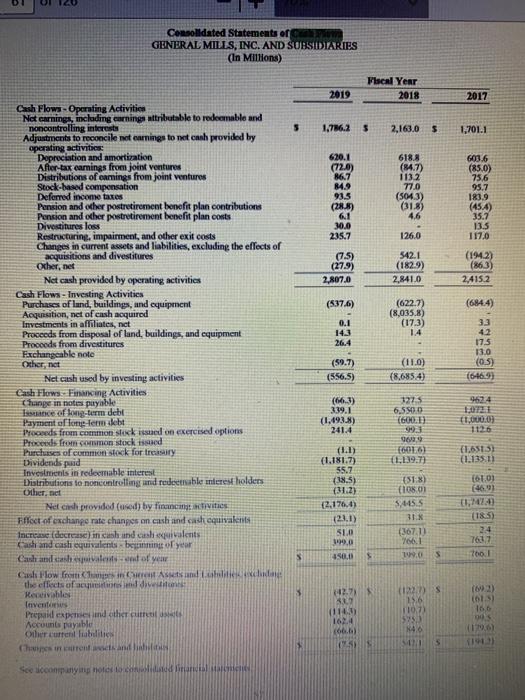
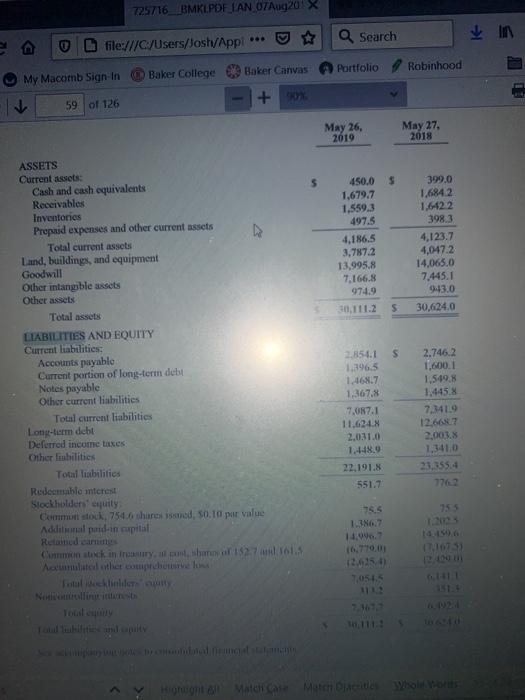
a. EYK14-5. Accounting Research Problem: General Mills, Inc. The fiscal year 2017 annual report of Gen- eral Mills, Inc. is available on this book's web site. Required Calculate (or identify the following financial ratios for 2016 and 2017: 1. Gross profit percentage 2. Return on sales 3. Asset turnover (2015, total assets = $21,832.0 million) 4. Return on assets (2015, total assets = $21,832.0 million) 5. Return on common stockholders' equity (2015. total stockholders' equity = $4.996.7 million) 6. Current ratio 7. Quick ratio 8. Operating-cash-flow-to-current-liabilities ratio (2015, current liabilities = $4,890.1 million) 9. Accounts receivable turnover (2015. accounts receivable = $1,386.7 million) 10. Average collection period 11. Inventory turnover (2015, inventory = $1,540.9 million) 12. Days' sales in inventory 13. Debt-to-equity ratio 14. Times-interest-earned ratio 15. Operating-cash-flow-to-capital-expenditures ratio 16. Earnings per share 17. Price-earnings ratio (Use year-end adjusted closing stock price of $57.32 for 2017 and $63.69 for 2016.) 18. Dividend yield 19. Dividend payout ratio b. Comment briefly on the changes from fiscal 2016 to fiscal 2017 in the ratios computed above. unting The following table sets forth selected financial data for each of the fiscal years in the five-year period ended May 26, 2019: S In Millions, Except Per Share Data, Fiscal Year Percentages and Ratios 2019 (a) 2018 2017 2016 2015 (6) Operating data: Net sales $ 16,865.2 $ 15,740.4 $ 15,619.8 $ 16,563.1 $ 17,630.3 Gross margin (c) (d) 5,756.8 5,435.6 5,5678 5.843.3 5,967.8 Selling general, and administrative expenses (d) 2,935.8 2,850.1 2,888.8 3,1414 3,389.9 Operating profit (d) 2,5159 2,4199 2,492.1 2,719.1 2,071.8 Net carnings attributable to General Mills 1,752.7 2.131.0 1.6575 1.6974 1.221.3 Advertising and media expense 601.6 575.9 6238 7544 823.1 Research and development expense 221.9 219.1 218.2 222.1 229.4 Average shares outstanding: Diluted 605.4 585.7 5980 611.9 618.8 Earnings per share Diluted s 2.90 s 3.64 s 2.77 $ 2.77 $ 1.97 Adjusted diluted (e) (e) 3.22 $ 3.11 $ 3.08 $ 2.92 $ 2.86 Operating ratios: Gross margin as a percentage of net sales (d) 34.19% 34.5% 35.696 35.396 33.896 Selling, general, and administrative expenses as a percentage of met ales (d) 17.496 18.156 18.596 19.0% 19.296 Operating profit as a percentage of net les (d) 14.9% 15.4% 16.09 16.4% 1.8% Adjusted operating profit as a percentage of net sales (c) (d) () 16.99 16.64 17.6% 16.894 15.7% Iective income tale 17.7% 2.7% 28.8% 314" 13.39 Balance sheet data and buildings, and equipment S 1,787.2 $ 4,0472 $ 1,6877 5 1,7436 5 3,7811 Total acts 30.111.2 10.6240 21,8126 21.7123 21,8120 Long tunu debt, excluding current portion 11.624.8 12.668. 7.0429 7,057,7 7.5753 Total debtc) 14.490.0 15.RO 1,4817 8.4100 9.1915 Cash flow data Na wprowded by operating activities 5 2.8070 5 2,410 5 2.4152 5 3.7622 5 2.4 Capital expenditure 37.6 4.4 7134 Fro cash flow (c) 2.209.4 22 1.70 Share data Cadividend common 10 5 1.96 5 IN 5 L'infecal wird heute Mone see to the ancil Station of this post 0) 2015 year, the Riscal scan wr weeks (c) Marine of this jon for datino helped wing region the ordered GENERAL MILLS, INC. AND SUBSIDIARIES (in Millions, Except Par Value) May 26, 2019 May 27, 2018 $ $ 450.0 1.679.7 1,559.3 497.5 4,186.5 3,787.2 13,995.8 7,166.8 974.9 30.111.2 399.0 1,684.2 1,642.2 398.3 4,123.7 4,047.2 14,065.0 7,445.1 943.0 30,624.0 $ $ $ ASSETS Current assets Cash and cash equivalents Receivables Inventories Prepaid expenses and other current assets Total current assets Land, buildings, and equipment Goodwill Other intangible assets Other assets Total assets LIABILITIES AND EQUITY Current liabilities: Accounts payable Current portion of long-term debt Notes payable Other current liabilities Total current liabilities Long-term debt Deferred income taxes Other liabilities Total liabilities Redeemable interest Stockholders' equity: Common stock, 754,6 shares issued, $0.10 par value Additional paid-in capital Retained earnings Common stock in treasury, al cost shares of 152.7 and 161.5 Accumulated other comprehensive low Total stockholders' equity Noncontrolling interests Total oquity Total liabilities and equity 2,854.1 1,396.5 1,468.7 1,367.8 7,087.1 11.624.8 2,031.0 1.448.9 22,191.8 551.7 2,746.2 1,600.1 1,549.8 1.445.8 7.341.9 12,668.7 2.003.8 1.341.0 23,355.4 776.2 75.5 1.386.7 14.996.7 (6.779,0) 75.5 1.202.5 14,459,6 (7.167.5) (2.429,0) 6,141.1 351.3 7.054.5 31.1.2 7.367.7 30.111.2 6.192.4 S 30.624.0 Consolidated Statements or GENERAL MILLS, INC. AND SUBSIDIARIES (In Millions) Fiscal Year 2018 2019 2017 5 1.716.25 2,163,0 $ 1.701.1 620.1 (72.0) 86.7 84.9 93.5 (28,8) 6.1 30.0 235.7 618.8 (84.7) 1132 77.0 (5043) (31.8) 4,6 6036 (85.0) 75,6 95.7 183.9 (454) 35.7 126.0 13.5 117,0 (7.5) (279) 2,807.0 542.1 (182.9) 2,841.0 (1942) (863) 2,4152 (537.6) (622.7) (8,035.8) (17.3) 0.1 14.3 Cash Flows - Operating Activities Net earnings, including earnings attributable to redeemable and noncontrolling interest Adjustments to reconcile met earnings to net cash provided by operating activities Depreciation and amortization After-tax earnings from joint ventures Distributions of crmings from joint ventures Stock-based compensation Deferred income taxes Pension and other postretirement benefit plan contributions Pension and other postretirement benefit plan costs Divestitures loss Restructuring, impairment, and other exit costs Changes in current assets and liabilities, excluding the effects of acquisitions and divestitures Other, net Net cash provided by operating activities Cash Flows - Investing Activities Purchases of land, buildings, and equipment Acquisition, net of cash acquired Investments in affiliates, net Proceeds from disposal of land, buildings, and equipment Proceeds from divertitures Fxchangeable note Other, not Net cash used by investing activities Cash Flows. Financing Activities change in notes puyable Istance of long-term debl Payment of long-femmet Proceeds from common stock issued on exercised options Proceeds from somon stocked Purchases of common stock for treaty Dividends puid Investments in redeemable interest Distributions to no controlling and redeetable interest holders Othernet Net Ces provided (used) by financmctivities Effect of exchange rate changes en cash and cast equivalen Incre decrease in ushind shivalents Cash and cash equivalents being of year Cash and cashewesend a year Cash Flow from Alicia the effects of action de Receivable ( Inventos Prepal experiend other current 3 Accounts payable Other current liabilities Chasirent and (684.4) 33 42 175 13.0 (05) (646.9) (59.7) (556.5) (110) (8.6854) (663) 339.1 (1.193.8) 241.4 1223 6.550 (600 9 9029 9624 ET 1,000.00 1,139.77 (1.6515 (1.135.1) 1610) (469 1.181.7) 55.7 (38.5) 31.2) 12.176.0) (22.1) 51.0 2.0 4500 1818) 1080 54455 31% (3671) 7661 (185) 2.4 7617 7601 S 5 3 42. 166 (140 1624 (6) ( WS (127) 15.6 1107 55 N46 5 See companying not to 725716_BMKLPDF TAN OTAug 20 X Q Search I In file:///C:/Users/Josh/Appl *** Baker College Baker Canvas My Macomb Sign In Portfolio Robinhood + 59 of 126 May 26, 2019 May 27. 2018 5 S 450.0 1.679.7 1,559,3 497.5 4,186.5 3,787.2 13.995.8 7.166.8 974.9 399.0 1.6842 1.62.2 398.3 4,123.7 4,0472 14.065.0 7.445.1 43.0 5 30,624.0 S ASSETS Current assets Cash and cash equivalents Receivables Inventories Prepaid expenses and other current assets Total current asset Land, buildings, and equipment Goodwill Other intangible assets Other assets Total assets LIABILITIES AND EQUITY Current liabilities Accounts payable Current portion of long-term det Notes payable Other current liabilities Total current liabilities Long-term debt Deferred income taxes Other libilities Total liabilities Redeemable micres Stockholders equity Common stock, 754.6 shares wied, 50.10 par value Additional and in capital Retamed cars Consteck in rury, ban 1827161 Altithet comprehensive 2.854.1 1.396.5 1.468.7 1.367.8 7.087.1 11.624N 2.746.2 1,600.1 1,549.8 1.445.8 7.341.9 12.667 2003. 1,341,0 23,155.4 1.448.9 22,191.8 551.7 55 1.367 16,770,00 07.1679 7051