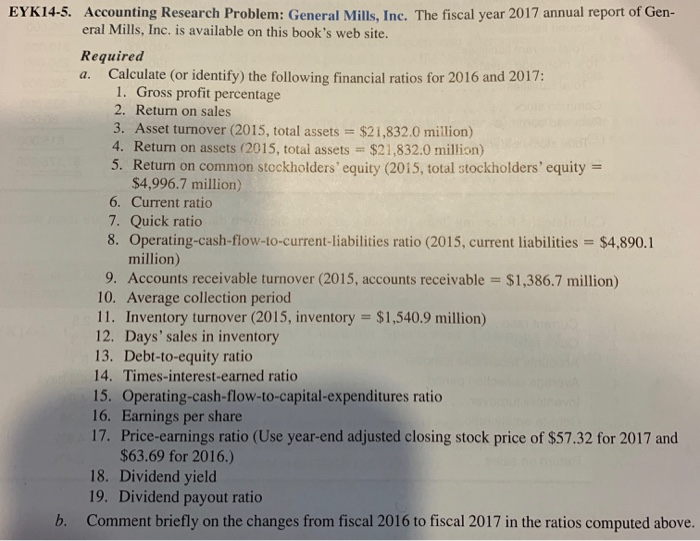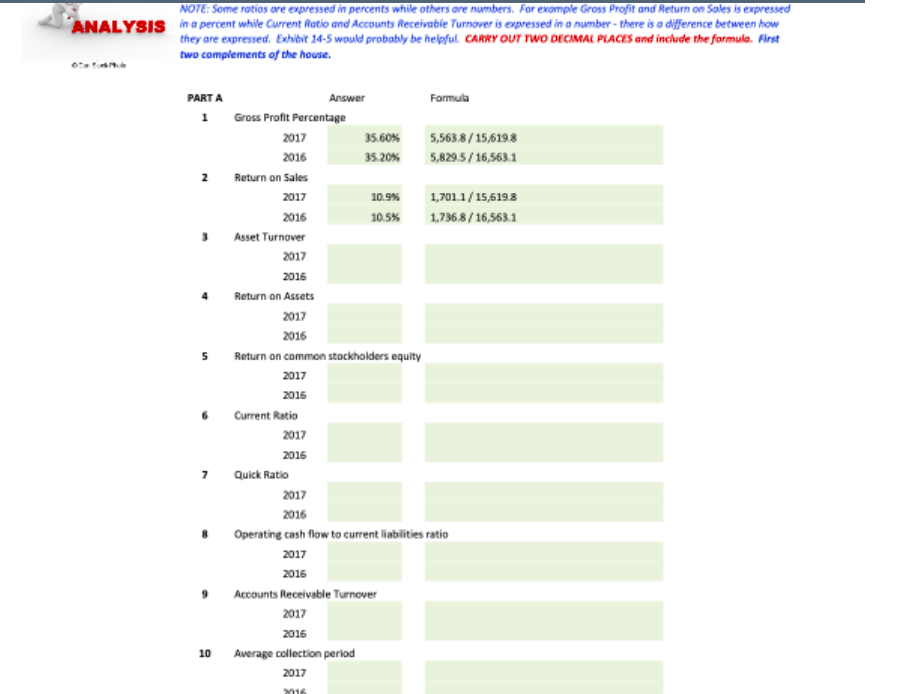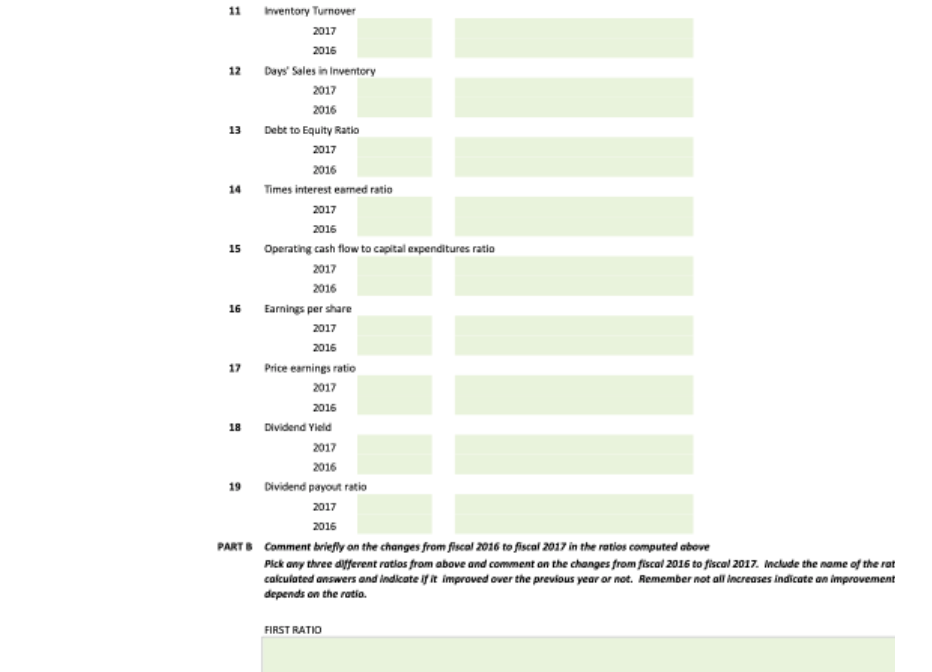


a. EYK14-5. Accounting Research Problem: General Mills, Inc. The fiscal year 2017 annual report of Gen- eral Mills, Inc. is available on this book's web site. Required Calculate (or identify the following financial ratios for 2016 and 2017: 1. Gross profit percentage 2. Return on sales 3. Asset turnover (2015, total assets = $21,832.0 million) 4. Return on assets (2015, total assets == - $21,832.0 million) 5. Return on common stockholders' equity (2015, total stockholders' equity $4,996.7 million) 6. Current ratio 7. Quick ratio 8. Operating-cash-flow-to-current liabilities ratio (2015, current liabilities = $4,890.1 million) 9. Accounts receivable turnover (2015, accounts receivable = $1,386.7 million) 10. Average collection period 11. Inventory turnover (2015, inventory = $1,540.9 million) 12. Days' sales in inventory 13. Debt-to-equity ratio 14. Times-interest-earned ratio 15. Operating-cash-flow-to-capital-expenditures ratio 16. Earnings per share 17. Price-earnings ratio (Use year-end adjusted closing stock price of $57.32 for 2017 and $63.69 for 2016.) 18. Dividend yield 19. Dividend payout ratio b. Comment briefly on the changes from fiscal 2016 to fiscal 2017 in the ratios computed above. NOTE: Some ratios are expressed in percents while others are numbers. For example Gross Profit and Return on Sales is expressed ANALYSIS in a percent while Current Ratio and Accounts Receivable Turnover is expressed in a number - there is a difference between how they are expressed. Exhibit 14-5 would probably be helpful CARRY OUT TWO DECIMAL PLACES and include the formula. First two complements of the house. 0. 2016 10.5% PARTA Answer Formula 1 Gross Profit Percentage 2017 35.60% 5,563.8/15,619.8 2016 35.20% 5,829.5/16,5631 2 Return on Sales 2017 10.9% 1,701.1/ 15,619.8 1,736,8/16,5631 Asset Turnover 2017 2016 Return on Assets 2017 2016 Return on common stockholders equity 2017 2016 Current Ratio 2017 2016 Quick Ratio 2017 2016 Operating cash flow to current liabilities ratio 2017 2016 Accounts Receivable Turnover 2017 2016 Average collection period 2017 7 10 16 11 Inventory Turnover 2017 2016 12 Days Sales in Inventory 2017 2016 13 Debt to Equity Ratio 2017 2016 14 Times interest earned ratio 2017 2016 15 Operating cash flow to capital expenditures ratio 2017 2016 16 Earnings per share 2017 2016 17 Price earnings ratio 2017 2016 Dividend Yield 2017 2016 19 Dividend payout ratio 2017 2016 PARTS Comment briefly on the changes from fiscal 2016 to fiscal 2017 in the ratios computed above Pick any three different ratios from above and comment on the changes from fiscal 2015 to fiscal 2017. Include the name of the rat calculated answers and indicate if it improved over the previous year or not. Remember not all increases indicate an improvement depends on the ratio. 18 FIRST RATIO a. EYK14-5. Accounting Research Problem: General Mills, Inc. The fiscal year 2017 annual report of Gen- eral Mills, Inc. is available on this book's web site. Required Calculate (or identify the following financial ratios for 2016 and 2017: 1. Gross profit percentage 2. Return on sales 3. Asset turnover (2015, total assets = $21,832.0 million) 4. Return on assets (2015, total assets == - $21,832.0 million) 5. Return on common stockholders' equity (2015, total stockholders' equity $4,996.7 million) 6. Current ratio 7. Quick ratio 8. Operating-cash-flow-to-current liabilities ratio (2015, current liabilities = $4,890.1 million) 9. Accounts receivable turnover (2015, accounts receivable = $1,386.7 million) 10. Average collection period 11. Inventory turnover (2015, inventory = $1,540.9 million) 12. Days' sales in inventory 13. Debt-to-equity ratio 14. Times-interest-earned ratio 15. Operating-cash-flow-to-capital-expenditures ratio 16. Earnings per share 17. Price-earnings ratio (Use year-end adjusted closing stock price of $57.32 for 2017 and $63.69 for 2016.) 18. Dividend yield 19. Dividend payout ratio b. Comment briefly on the changes from fiscal 2016 to fiscal 2017 in the ratios computed above. NOTE: Some ratios are expressed in percents while others are numbers. For example Gross Profit and Return on Sales is expressed ANALYSIS in a percent while Current Ratio and Accounts Receivable Turnover is expressed in a number - there is a difference between how they are expressed. Exhibit 14-5 would probably be helpful CARRY OUT TWO DECIMAL PLACES and include the formula. First two complements of the house. 0. 2016 10.5% PARTA Answer Formula 1 Gross Profit Percentage 2017 35.60% 5,563.8/15,619.8 2016 35.20% 5,829.5/16,5631 2 Return on Sales 2017 10.9% 1,701.1/ 15,619.8 1,736,8/16,5631 Asset Turnover 2017 2016 Return on Assets 2017 2016 Return on common stockholders equity 2017 2016 Current Ratio 2017 2016 Quick Ratio 2017 2016 Operating cash flow to current liabilities ratio 2017 2016 Accounts Receivable Turnover 2017 2016 Average collection period 2017 7 10 16 11 Inventory Turnover 2017 2016 12 Days Sales in Inventory 2017 2016 13 Debt to Equity Ratio 2017 2016 14 Times interest earned ratio 2017 2016 15 Operating cash flow to capital expenditures ratio 2017 2016 16 Earnings per share 2017 2016 17 Price earnings ratio 2017 2016 Dividend Yield 2017 2016 19 Dividend payout ratio 2017 2016 PARTS Comment briefly on the changes from fiscal 2016 to fiscal 2017 in the ratios computed above Pick any three different ratios from above and comment on the changes from fiscal 2015 to fiscal 2017. Include the name of the rat calculated answers and indicate if it improved over the previous year or not. Remember not all increases indicate an improvement depends on the ratio. 18 FIRST RATIO


