

Question
A factory has six production departments: M (milling), D (drilling), T (turning), G (grinding), F (finishing) and A( Assembly). Products are routed for processing through
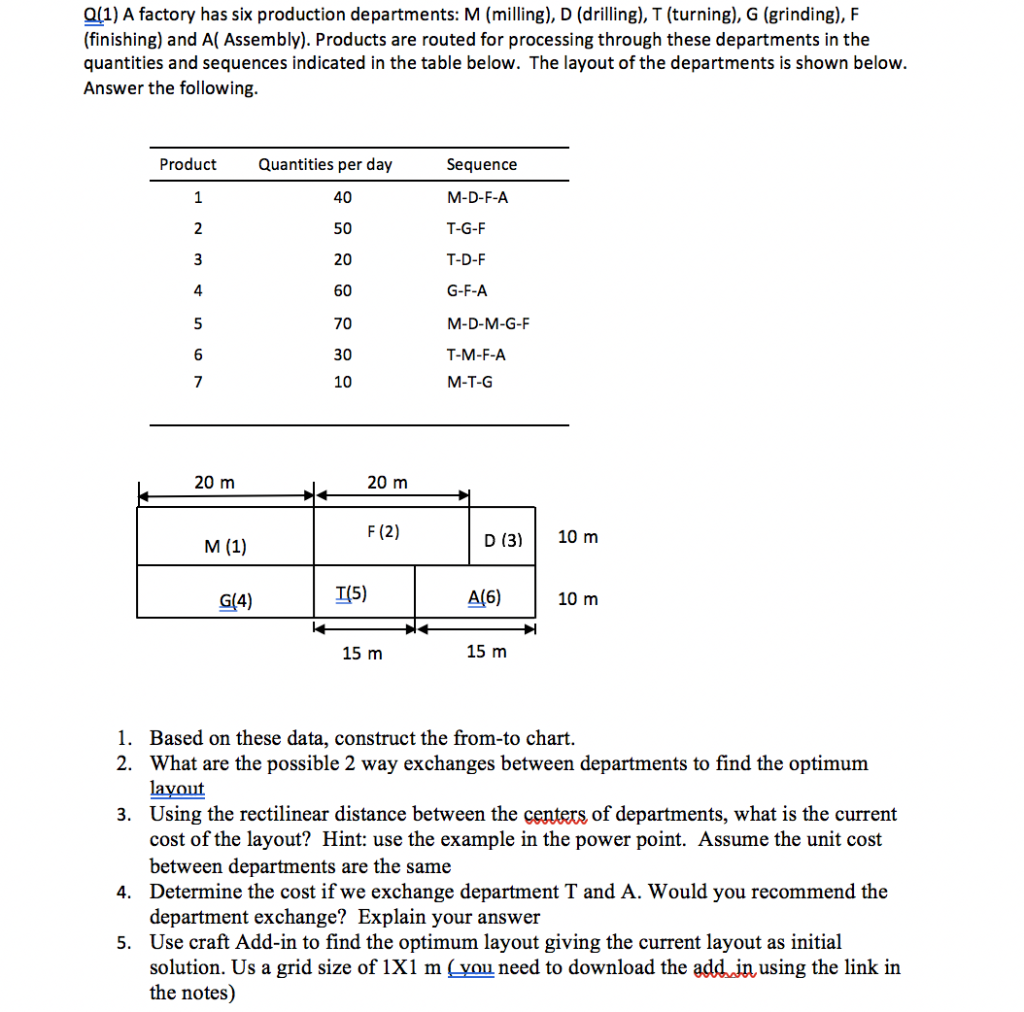
A factory has six production departments: M (milling), D (drilling), T (turning), G (grinding), F (finishing) and A( Assembly). Products are routed for processing through these departments in the quantities and sequences indicated in the table below. The layout of the departments is shown below. Answer the following.
please solve 1-5 using the instructions.
0(1) A factory has six production departments: M (milling), D (drilling), T (turning), G (grinding), F (finishing) and Al Assembly). Products are routed for processing through these departments in the quantities and sequences indicated in the table below. The layout of the departments is shown below. Answer the following. Product Quantities per day Sequence M-D-F-A T-G-F T-D-F G-F-A M-D-M-G-F T-M-F-A M-T-G 20 m 20 m F (2) M (1) D (3) | 10 m G[4) A(6) 10 m T(5) IN 15 m 15 m 1. Based on these data, construct the from-to chart. 2. What are the possible 2 way exchanges between departments to find the optimum layout 3. Using the rectilinear distance between the centers of departments, what is the current cost of the layout? Hint: use the example in the power point. Assume the unit cost between departments are the same 4. Determine the cost if we exchange department T and A. Would you recommend the department exchange? Explain your answer 5. Use craft Add-in to find the optimum layout giving the current layout as initial solution. Us a grid size of 1X1 m (you need to download the add. in using the link in the notes) 0(1) A factory has six production departments: M (milling), D (drilling), T (turning), G (grinding), F (finishing) and Al Assembly). Products are routed for processing through these departments in the quantities and sequences indicated in the table below. The layout of the departments is shown below. Answer the following. Product Quantities per day Sequence M-D-F-A T-G-F T-D-F G-F-A M-D-M-G-F T-M-F-A M-T-G 20 m 20 m F (2) M (1) D (3) | 10 m G[4) A(6) 10 m T(5) IN 15 m 15 m 1. Based on these data, construct the from-to chart. 2. What are the possible 2 way exchanges between departments to find the optimum layout 3. Using the rectilinear distance between the centers of departments, what is the current cost of the layout? Hint: use the example in the power point. Assume the unit cost between departments are the same 4. Determine the cost if we exchange department T and A. Would you recommend the department exchange? Explain your answer 5. Use craft Add-in to find the optimum layout giving the current layout as initial solution. Us a grid size of 1X1 m (you need to download the add. in using the link in the notes)Step by Step Solution
There are 3 Steps involved in it
Step: 1

Get Instant Access to Expert-Tailored Solutions
See step-by-step solutions with expert insights and AI powered tools for academic success
Step: 2

Step: 3
Ace Your Homework with AI
Get the answers you need in no time with our AI-driven, step-by-step assistance
Get Started
Managerial Accounting 1
Authors: Ray H. Garrison
1st Edition
1259114457, 978-1259114458