

Answered step by step
Verified Expert Solution
Question
1 Approved Answer
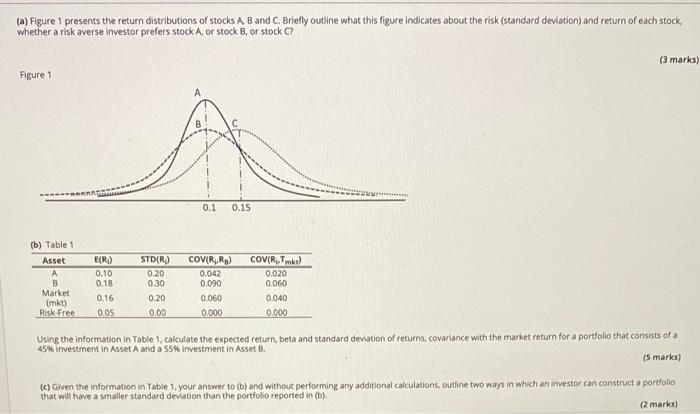
(a) Figure 1 presents the return distributions of stocks A B and C. Briefly outline what this ligure indicates about the risk (standard deviation) and
Step by Step Solution
There are 3 Steps involved in it
Step: 1

Get Instant Access to Expert-Tailored Solutions
See step-by-step solutions with expert insights and AI powered tools for academic success
Step: 2

Step: 3
Ace Your Homework with AI
Get the answers you need in no time with our AI-driven, step-by-step assistance
Get Started
Cash The Fuel For Your Economic Engine
Authors: Jeffrey A Redmon, Adam Siegel
1st Edition
0578686031, 978-0578686035