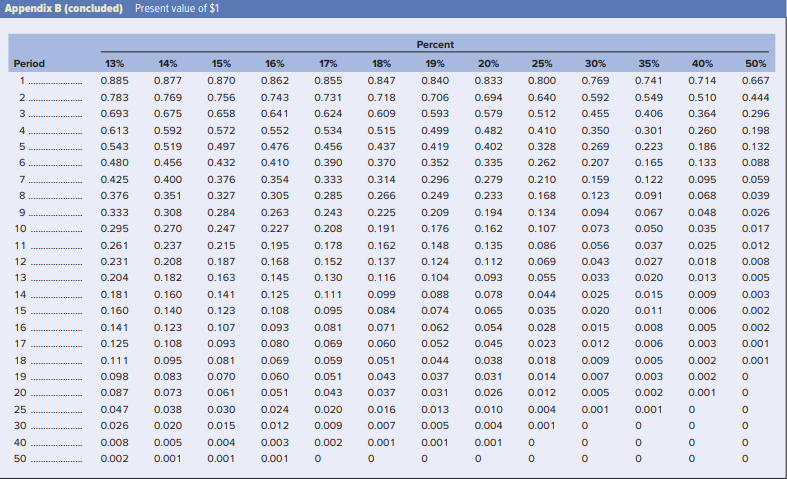
a. Fill in the following table from Appendix B Round your answers to 3 decimal places.) 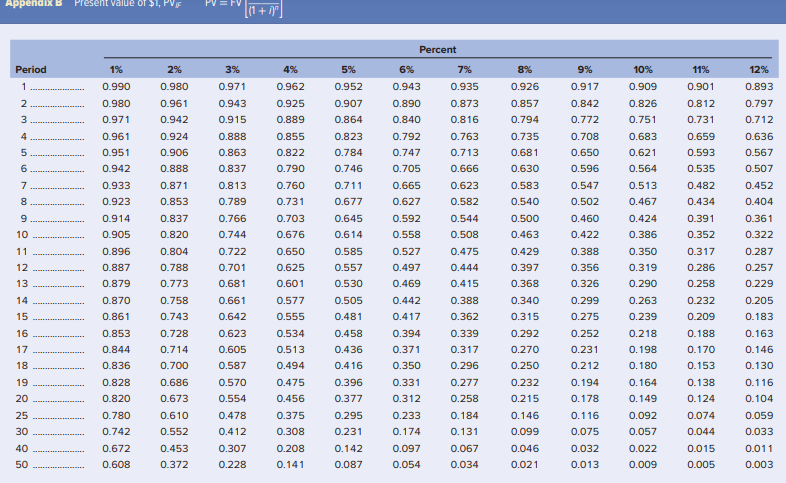
b. Does the choice between a low or a high discount rate have a greater impact on short-term or long-term cash flows?
multiple choice
Appendix B Present Value of $I, PVF [{1+) Percent 1% 3% 4% 5% 6% 7% 11% 12% Period 1 2 2% 0.980 8% 0.926 9% 0.917 0.990 0.962 0.952 3 4 0.901 0.812 0.731 0.659 0.593 0.535 0.980 0.971 0.961 0.951 0.942 0.933 0.923 0.914 0.905 5 0.943 0.890 0.840 0.792 0.747 0.705 0.665 0.627 0.592 0.558 0.893 0.797 0.712 0.636 0.567 0.507 0.452 0.404 7 8 0.482 0.434 0.391 0.352 0.907 0.864 0.823 0.784 0.746 0.711 0.677 0.645 0.614 0.585 0.557 0.530 0.505 0.481 9 10 11 12 13 0.961 0.942 0.924 0.906 0.888 0.871 0.853 0.837 0.820 0.804 0.788 0.773 0.758 0.743 0.728 0.714 0.700 0.686 0.673 0.610 0.552 0.453 0.372 0.896 0.887 0.879 0.870 0.861 0.971 0.943 0.915 0.888 0.863 0.837 0.813 0.789 0.766 0.744 0.722 0.701 0.681 0.661 0.642 0.623 0.605 0.587 0.570 0.554 0.478 0.412 0.307 0.228 0.925 0.889 0.855 0.822 0.790 0.760 0.731 0.703 0.676 0.650 0.625 0.601 0.577 0.555 0.534 0.513 0.494 0.475 0.456 0.375 0.308 0.208 0.141 0.935 0.873 0.816 0.763 0.713 0.666 0.623 0.582 0.544 0.508 0.475 0.444 0.415 0.388 0.362 0.339 0.317 0.296 0.277 0.258 0.184 0.131 0.067 0.034 0.857 0.794 0.735 0.681 0.630 0.583 0.540 0.500 0.463 0.429 0.397 0.368 0.340 0.315 0.292 0.270 0.250 0.232 0.215 0.146 0.099 0.046 0.021 0.842 0.772 0.708 0.650 0.596 0.547 0.502 0.460 0.422 0.388 0.356 0.326 0.299 0.275 0.252 0.231 0.212 0.194 0.178 10% 0.909 0.826 0.751 0.683 0.621 0.564 0.513 0.467 0.424 0.386 0.350 0.319 0.290 0.263 0.239 0.218 0.198 0.180 0.164 0.149 0.092 0.057 0.022 0.009 0.527 0.497 0.469 0.442 0.417 0.394 0.371 0.350 0.331 0.312 0.233 0.174 0.097 0.054 14 15 16 17 18 0.853 0.844 0.836 0.828 0.820 0.458 0.436 0.416 0.396 0.377 0.295 0.231 0.142 0.087 0.317 0.286 0.258 0.232 0.209 0.188 0.170 0.153 0.138 0.124 0.074 0.044 0.015 0.005 0.361 0.322 0.287 0.257 0.229 0.205 0.183 0.163 0.146 0.130 0.116 0.104 0.059 0.033 0.011 0.003 19 20 25 0.780 30 0.116 0.075 0.032 0.013 0.742 0.672 0.608 40 50 Appendix B (concluded) Present value of $1 Period 1 17% 0.855 35% 0.741 N n o oo 16% 0.862 0.743 0.641 0.552 0.476 0.410 0.354 0.305 0.263 0.227 7 9 10 13% 0.885 0.783 0.693 0.613 0.543 0.480 0.425 0.376 0.333 0.295 0.261 0.231 0.204 0.181 0.160 0.141 0.125 0.111 0.098 0.087 0.047 0.026 0.008 0.002 14% 0.877 0.769 0.675 0.592 0.519 0.456 0.400 0.351 0.308 0.270 0.237 0.208 0.182 0.160 0.140 0.123 0.108 0.095 0.083 0.073 0.038 0.020 0.005 0.001 11 15% 0.870 0.756 0.658 0.572 0.497 0.432 0.376 0.327 0.284 0.247 0.215 0.187 0.163 0.141 0.123 0.107 0.093 0.081 0.070 0.061 0.030 0.015 0.004 0.001 Percent 19% 0.840 0.706 0.593 0.499 0.419 0.352 0.296 0.249 0.209 0.176 0.148 0.124 0.104 0.088 0.074 0.062 0.052 0.044 0.037 0.031 0.013 0.005 0.001 18% 0.847 0.718 0.609 0.515 0.437 0.370 0.314 0.266 0.225 0.191 0.162 0.137 0.116 0.099 0.084 0.071 0.060 0.051 0.043 0.037 0.016 0.007 0.001 0.731 0.624 0.534 0.456 0.390 0.333 0.285 0.243 0.208 0.178 0.152 0.130 0.111 0.095 0.081 0.069 0.059 0.051 0.043 0.020 0.009 0.002 12 20% 0.833 0.694 0.579 0.482 0.402 0.335 0.279 0.233 0.194 0.162 0.135 0.112 0.093 0.078 0.065 0.054 0.045 0.038 0.031 0.026 0.010 0.004 0.001 30% 0.769 0.592 0.455 0.350 0.269 0.207 0.159 0.123 0.094 0.073 0.056 0.043 0.033 0.025 0.020 0.015 0.012 0.009 0.007 0.005 0.001 25% 0.800 0.640 0.512 0.410 0.328 0.262 0.210 0.168 0.134 0.107 0.086 0.069 0.055 0.044 0.035 0.028 0.023 0.018 0.014 0.012 0.004 0.001 40% 0.714 0.510 0.364 0.260 0.186 0.133 0.095 0.068 0.048 0.035 0.025 0.018 0.013 0.009 0.006 0.005 0.003 0.002 0.002 0.001 50% 0.667 0.444 0.296 0.198 0.132 0.088 0.059 0.039 0.026 0.017 0.012 0.008 0.005 0.003 0.002 0.002 0.001 0.001 0.549 0.406 0.301 0.223 0.165 0.122 0.091 0.067 0.050 0.037 0.027 0.020 0.015 0.011 0.008 0.006 0.005 0.003 0.002 0.001 0.195 0.168 0.145 0.125 0.108 0.093 0.080 0.069 0.060 0.051 0.024 0.012 0.003 0.001 13 14 15 16 17 18 19 20 25 30 40 50 Appendix B Present Value of $I, PVF [{1+) Percent 1% 3% 4% 5% 6% 7% 11% 12% Period 1 2 2% 0.980 8% 0.926 9% 0.917 0.990 0.962 0.952 3 4 0.901 0.812 0.731 0.659 0.593 0.535 0.980 0.971 0.961 0.951 0.942 0.933 0.923 0.914 0.905 5 0.943 0.890 0.840 0.792 0.747 0.705 0.665 0.627 0.592 0.558 0.893 0.797 0.712 0.636 0.567 0.507 0.452 0.404 7 8 0.482 0.434 0.391 0.352 0.907 0.864 0.823 0.784 0.746 0.711 0.677 0.645 0.614 0.585 0.557 0.530 0.505 0.481 9 10 11 12 13 0.961 0.942 0.924 0.906 0.888 0.871 0.853 0.837 0.820 0.804 0.788 0.773 0.758 0.743 0.728 0.714 0.700 0.686 0.673 0.610 0.552 0.453 0.372 0.896 0.887 0.879 0.870 0.861 0.971 0.943 0.915 0.888 0.863 0.837 0.813 0.789 0.766 0.744 0.722 0.701 0.681 0.661 0.642 0.623 0.605 0.587 0.570 0.554 0.478 0.412 0.307 0.228 0.925 0.889 0.855 0.822 0.790 0.760 0.731 0.703 0.676 0.650 0.625 0.601 0.577 0.555 0.534 0.513 0.494 0.475 0.456 0.375 0.308 0.208 0.141 0.935 0.873 0.816 0.763 0.713 0.666 0.623 0.582 0.544 0.508 0.475 0.444 0.415 0.388 0.362 0.339 0.317 0.296 0.277 0.258 0.184 0.131 0.067 0.034 0.857 0.794 0.735 0.681 0.630 0.583 0.540 0.500 0.463 0.429 0.397 0.368 0.340 0.315 0.292 0.270 0.250 0.232 0.215 0.146 0.099 0.046 0.021 0.842 0.772 0.708 0.650 0.596 0.547 0.502 0.460 0.422 0.388 0.356 0.326 0.299 0.275 0.252 0.231 0.212 0.194 0.178 10% 0.909 0.826 0.751 0.683 0.621 0.564 0.513 0.467 0.424 0.386 0.350 0.319 0.290 0.263 0.239 0.218 0.198 0.180 0.164 0.149 0.092 0.057 0.022 0.009 0.527 0.497 0.469 0.442 0.417 0.394 0.371 0.350 0.331 0.312 0.233 0.174 0.097 0.054 14 15 16 17 18 0.853 0.844 0.836 0.828 0.820 0.458 0.436 0.416 0.396 0.377 0.295 0.231 0.142 0.087 0.317 0.286 0.258 0.232 0.209 0.188 0.170 0.153 0.138 0.124 0.074 0.044 0.015 0.005 0.361 0.322 0.287 0.257 0.229 0.205 0.183 0.163 0.146 0.130 0.116 0.104 0.059 0.033 0.011 0.003 19 20 25 0.780 30 0.116 0.075 0.032 0.013 0.742 0.672 0.608 40 50 Appendix B (concluded) Present value of $1 Period 1 17% 0.855 35% 0.741 N n o oo 16% 0.862 0.743 0.641 0.552 0.476 0.410 0.354 0.305 0.263 0.227 7 9 10 13% 0.885 0.783 0.693 0.613 0.543 0.480 0.425 0.376 0.333 0.295 0.261 0.231 0.204 0.181 0.160 0.141 0.125 0.111 0.098 0.087 0.047 0.026 0.008 0.002 14% 0.877 0.769 0.675 0.592 0.519 0.456 0.400 0.351 0.308 0.270 0.237 0.208 0.182 0.160 0.140 0.123 0.108 0.095 0.083 0.073 0.038 0.020 0.005 0.001 11 15% 0.870 0.756 0.658 0.572 0.497 0.432 0.376 0.327 0.284 0.247 0.215 0.187 0.163 0.141 0.123 0.107 0.093 0.081 0.070 0.061 0.030 0.015 0.004 0.001 Percent 19% 0.840 0.706 0.593 0.499 0.419 0.352 0.296 0.249 0.209 0.176 0.148 0.124 0.104 0.088 0.074 0.062 0.052 0.044 0.037 0.031 0.013 0.005 0.001 18% 0.847 0.718 0.609 0.515 0.437 0.370 0.314 0.266 0.225 0.191 0.162 0.137 0.116 0.099 0.084 0.071 0.060 0.051 0.043 0.037 0.016 0.007 0.001 0.731 0.624 0.534 0.456 0.390 0.333 0.285 0.243 0.208 0.178 0.152 0.130 0.111 0.095 0.081 0.069 0.059 0.051 0.043 0.020 0.009 0.002 12 20% 0.833 0.694 0.579 0.482 0.402 0.335 0.279 0.233 0.194 0.162 0.135 0.112 0.093 0.078 0.065 0.054 0.045 0.038 0.031 0.026 0.010 0.004 0.001 30% 0.769 0.592 0.455 0.350 0.269 0.207 0.159 0.123 0.094 0.073 0.056 0.043 0.033 0.025 0.020 0.015 0.012 0.009 0.007 0.005 0.001 25% 0.800 0.640 0.512 0.410 0.328 0.262 0.210 0.168 0.134 0.107 0.086 0.069 0.055 0.044 0.035 0.028 0.023 0.018 0.014 0.012 0.004 0.001 40% 0.714 0.510 0.364 0.260 0.186 0.133 0.095 0.068 0.048 0.035 0.025 0.018 0.013 0.009 0.006 0.005 0.003 0.002 0.002 0.001 50% 0.667 0.444 0.296 0.198 0.132 0.088 0.059 0.039 0.026 0.017 0.012 0.008 0.005 0.003 0.002 0.002 0.001 0.001 0.549 0.406 0.301 0.223 0.165 0.122 0.091 0.067 0.050 0.037 0.027 0.020 0.015 0.011 0.008 0.006 0.005 0.003 0.002 0.001 0.195 0.168 0.145 0.125 0.108 0.093 0.080 0.069 0.060 0.051 0.024 0.012 0.003 0.001 13 14 15 16 17 18 19 20 25 30 40 50