Answered step by step
Verified Expert Solution
Link Copied!

Question

1 Approved Answer

a.) Fill in the missing numbers of the Analysis-of-Variance table for MODEL I. b.) Do the data provide sufficient evidence to indicate that the tar

a.) Fill in the missing numbers of the Analysis-of-Variance table for MODEL I.

b.) Do the data provide sufficient evidence to indicate that the tar and nicotine in the Model 1 contribute information for the prediction of CO comparing with Model 3 at 5% significant level?
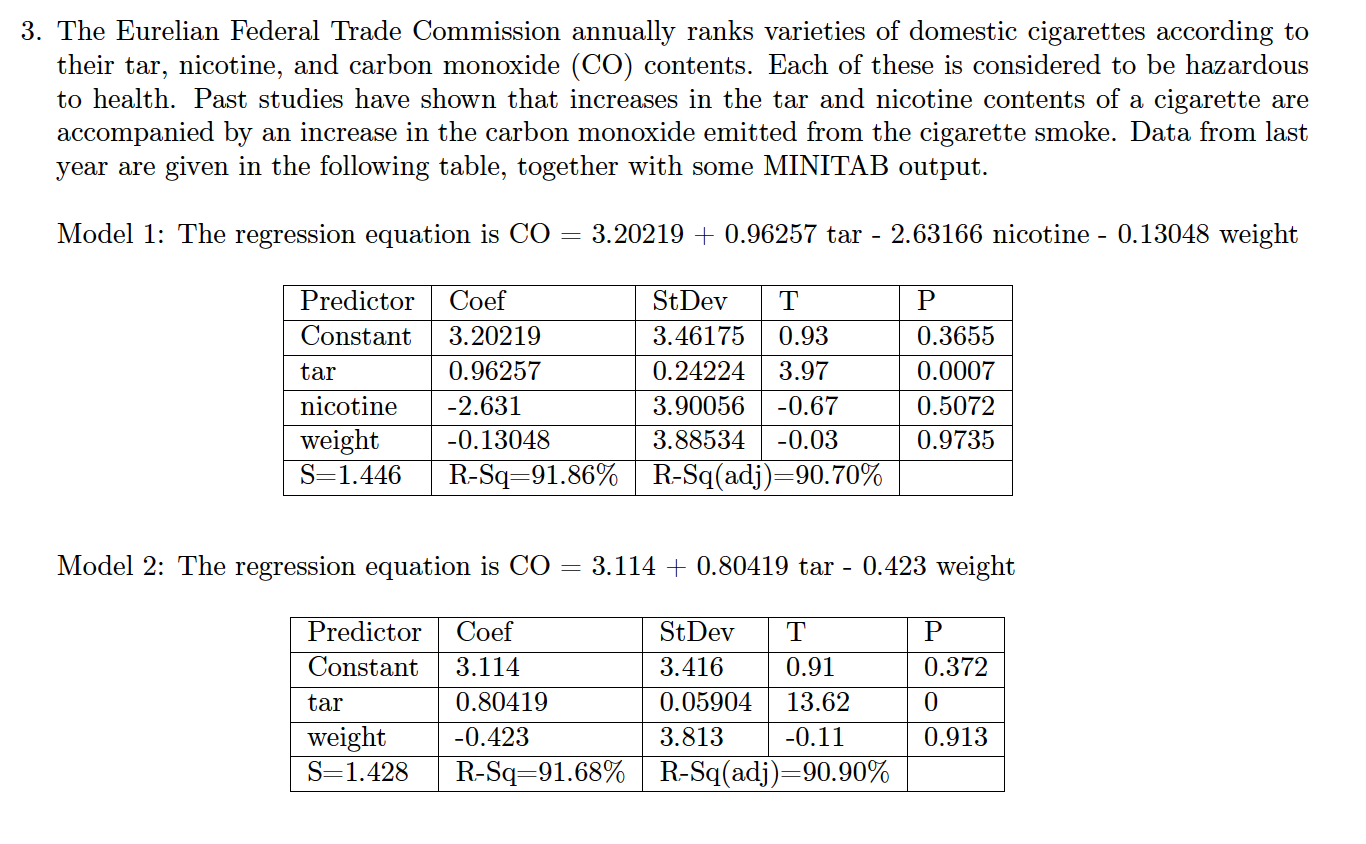
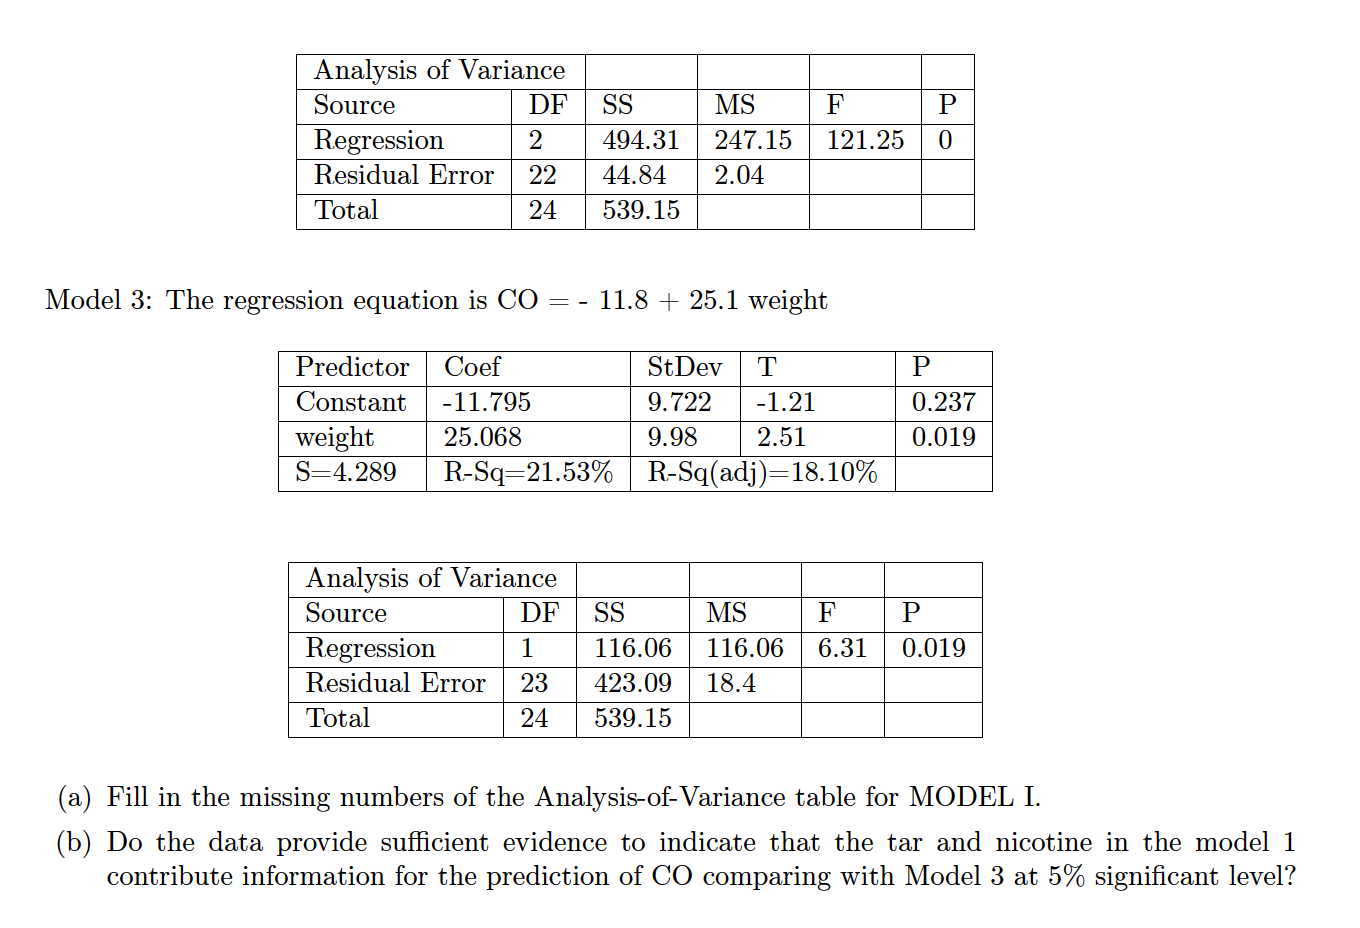
image text in transcribedimage text in transcribed
3. The Eurelian Federal rIfrade Commission annually ranks varieties of domestic cigarettes according to their tar, nicotine, and carbon monoxide (CO) contents. Each of these is considered to be hazardous to health. Past studies have shown that increases in the tar and nicotine contents of a cigarette are accompanied by an increase in the carbon monoxide emitted from the cigarette smoke. Data from last year are given in the following table, together with some MINITAB output. Model 1: The regression equation is CO = 3.20219 + 0.96257 tar 2.63166 nicotine 0.13048 weight Predictor Coef StDev T P Constant 3.20219 3.46175 0.93 0.3655 tar 0.96257 0.24224 3.97 0.0007 nicotine 2.631 3.90056 0.67 0.5072 weight -0. 13048 3.88534 -0.03 0.9735 S=1.446 RSq=91.86% RSq(adj )290.70% Model 2: The regression equation is CO : 3.114 + 0.80419 tar - 0.423 weight Predictor Coef StDetr T P Constant 3.114 3.416 0.91 0.372 tar 0.80419 0.05904 13.62 0 weight -0.423 3.813 -O.11 0.913 8:1.428 RSq:91.68% RSq(adj):90.90% Analysis of Variance Source DF SS MS F P Regression 2 494.31 247.15 121.25 0 Residual Error 22 44.84 2.04 Total 24 539.15 Model 3: The regression equation is CO = - 11.8 + 25.1 weight Predictor Coef StDev T P Constant -11.795 9.722 -1.21 0.237 weight 25.068 9.98 2.51 0.019 S-4.289 R-Sq=21.53% R-Sq(adj)=18.10% Analysis of Variance Source DF SS MS F P Regression 1 116.06 116.06 6.31 0.019 Residual Error 23 423.09 18.4 Total 24 539.15 (a) Fill in the missing numbers of the Analysis-of- Variance table for MODEL I. (b) Do the data provide sufficient evidence to indicate that the tar and nicotine in the model 1 contribute information for the prediction of CO comparing with Model 3 at 5% significant level

Step by Step Solution

There are 3 Steps involved in it

Step: 1

blur-text-image

Get Instant Access to Expert-Tailored Solutions

See step-by-step solutions with expert insights and AI powered tools for academic success

Step: 2

blur-text-image_2

Step: 3

blur-text-image_3

Ace Your Homework with AI

Get the answers you need in no time with our AI-driven, step-by-step assistance

Get Started

Recommended Textbook for

Linear Algebra With Applications

Authors: Gareth Williams, Williams

9th Edition

1284120104, 9781284120103

More Books

Students also viewed these Mathematics questions