

Answered step by step
Verified Expert Solution
Question
1 Approved Answer
A financial analyst is examining the relationship between stock prices and earnings per share. She chooses fifteen publicly traded companies at random and records for
A financial analyst is examining the relationship between stock prices and earnings per share. She chooses fifteen publicly traded companies at random and records for each the company's current stock price and the company's earnings per share reported for the past months. Her data are given below, with denoting the earnings per share from the previous year, and denoting the current stock price both in dollars Based on these data, she computes the least squares regression line to be hat This line, along with a scatter plot of her data, is shown below. Based on the analyst's data and regression line, complete the following. a For these data, current stock prices that are greater than the mean of the current stock prices tend to be paired with values for earnings per share that are Choose one the mean of the values for earnings per share. b According to the regression equation, for an increase of one dollar in earnings per share, there is a corresponding increase of how many dollars in current stock price? 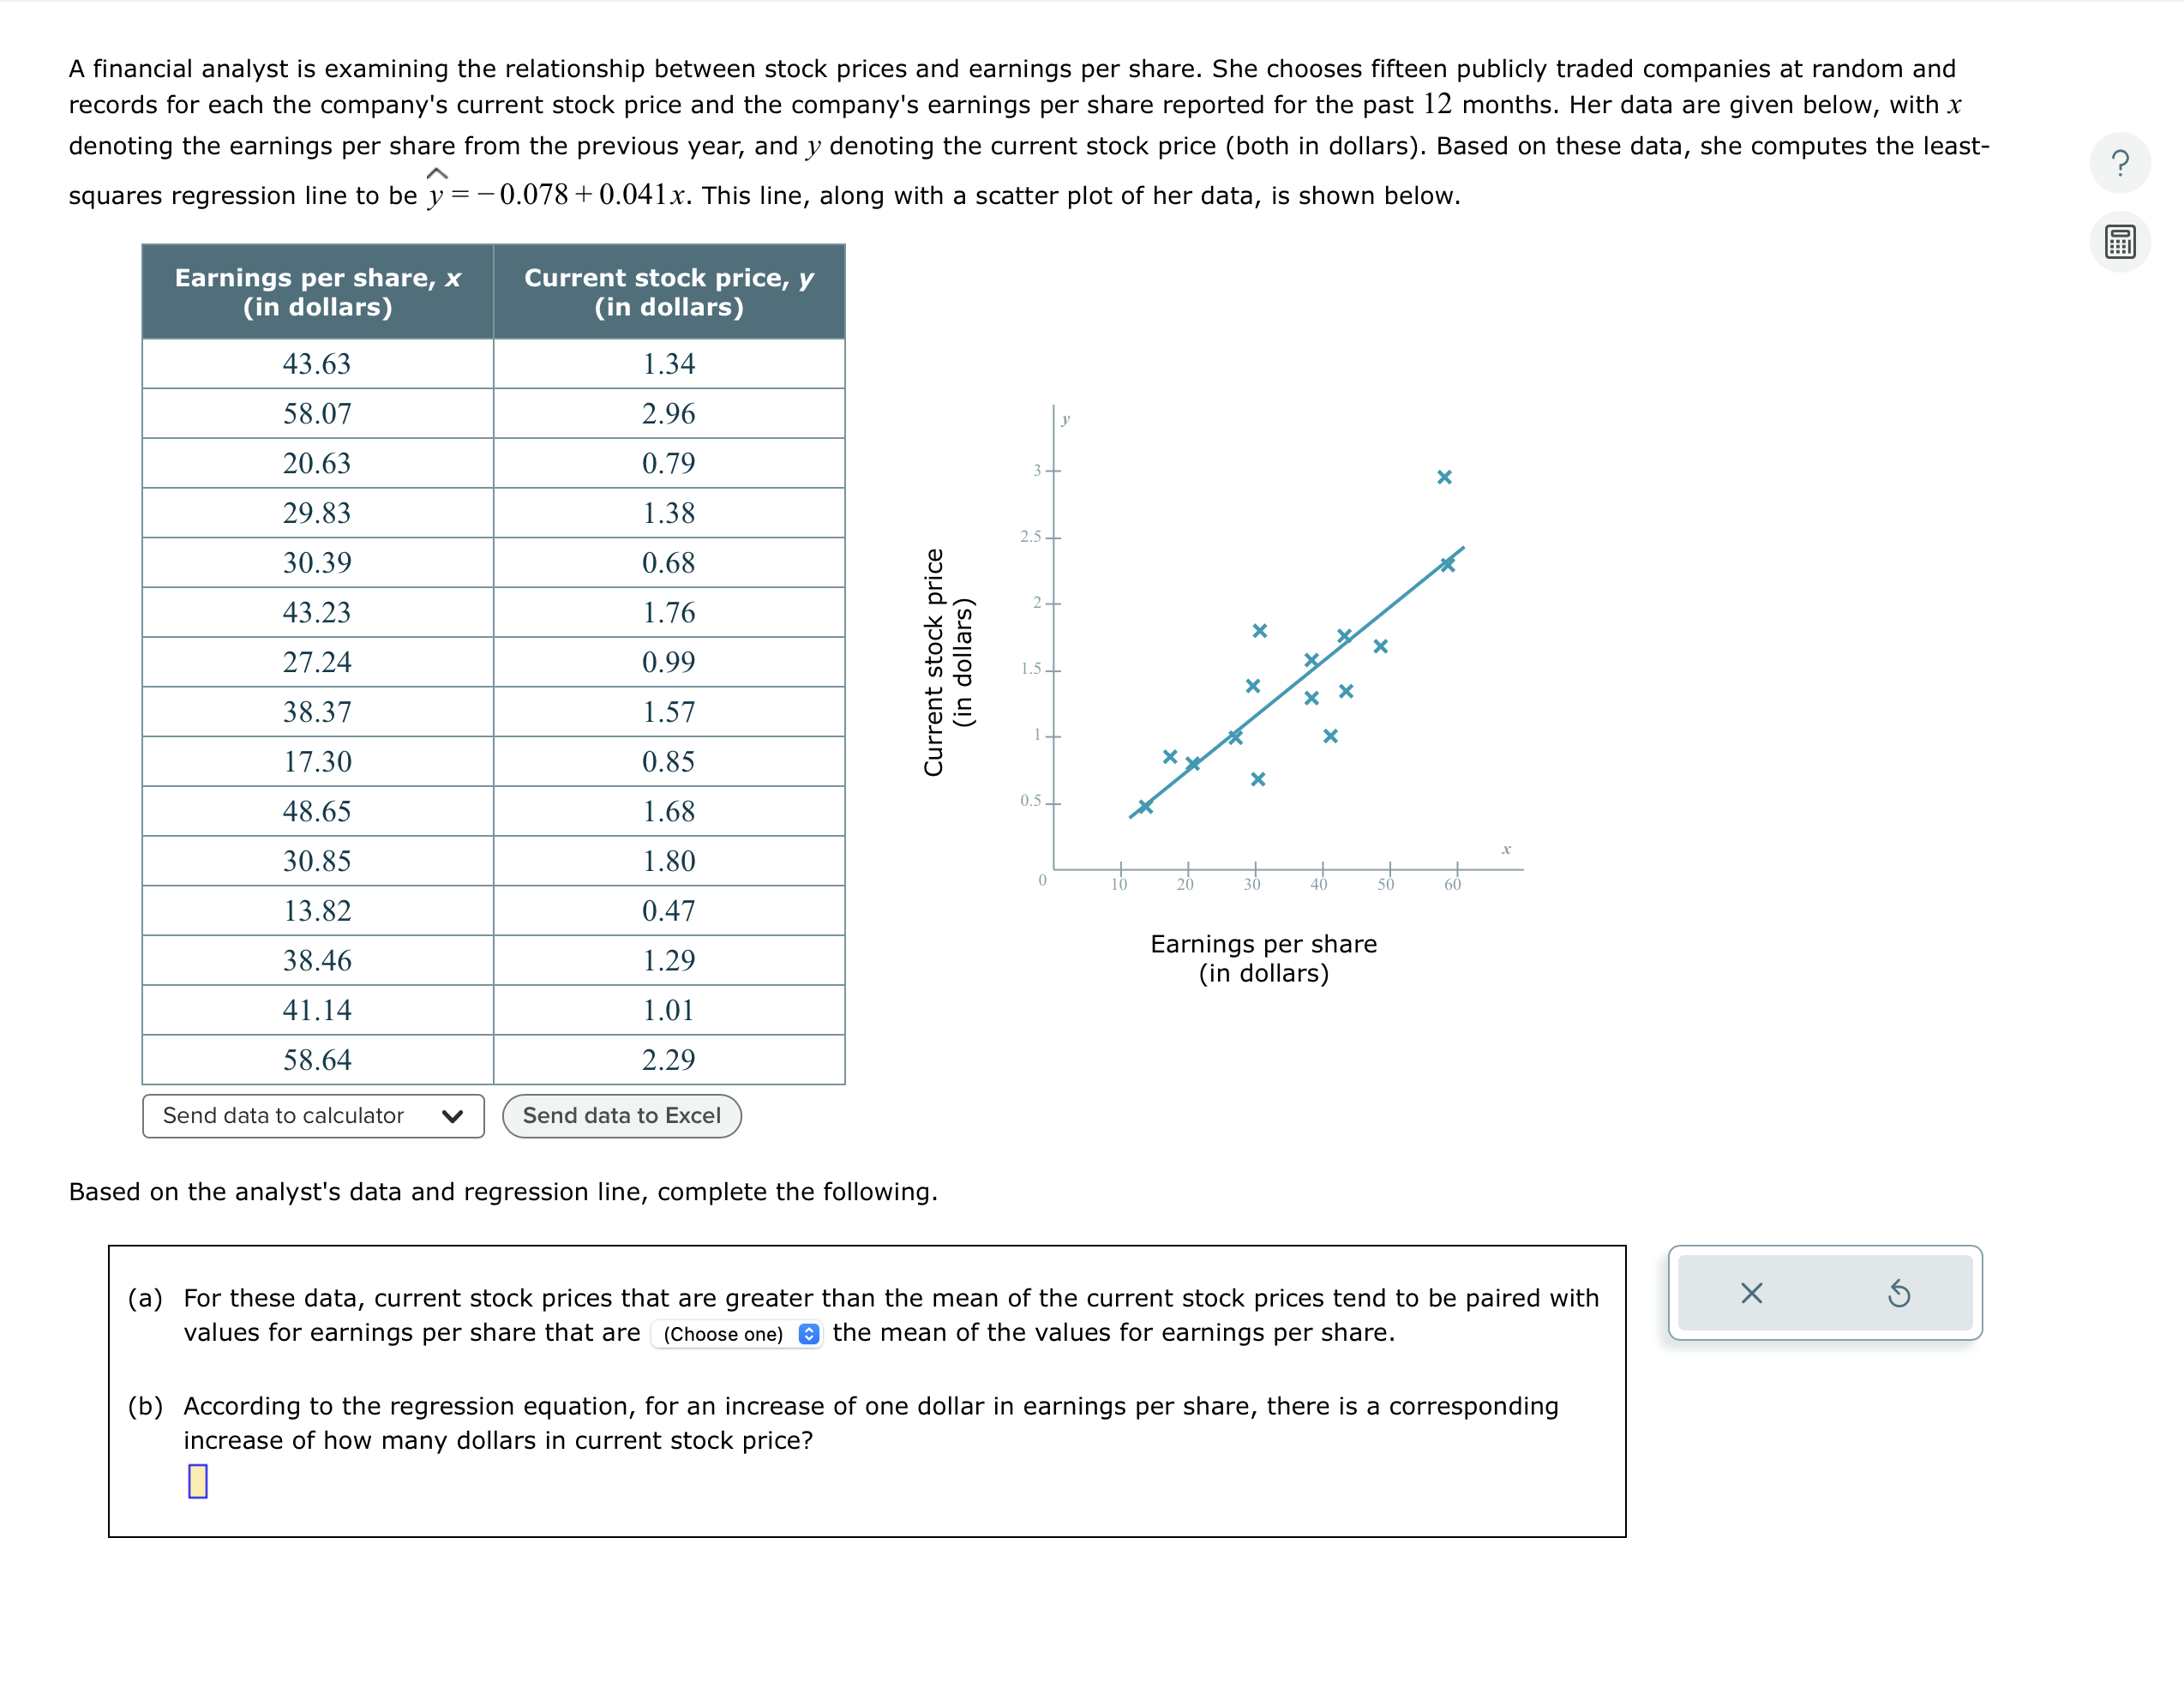
A financial analyst is examining the relationship between stock prices and earnings per share. She chooses fifteen publicly traded companies at random and
records for each the company's current stock price and the company's earnings per share reported for the past months. Her data are given below, with
denoting the earnings per share from the previous year, and denoting the current stock price both in dollars Based on these data, she computes the least
squares regression line to be hat This line, along with a scatter plot of her data, is shown below.
Based on the analyst's data and regression line, complete the following.
a For these data, current stock prices that are greater than the mean of the current stock prices tend to be paired with
values for earnings per share that are Choose one the mean of the values for earnings per share.
b According to the regression equation, for an increase of one dollar in earnings per share, there is a corresponding
increase of how many dollars in current stock price?
Step by Step Solution
There are 3 Steps involved in it
Step: 1

Get Instant Access to Expert-Tailored Solutions
See step-by-step solutions with expert insights and AI powered tools for academic success
Step: 2

Step: 3
Ace Your Homework with AI
Get the answers you need in no time with our AI-driven, step-by-step assistance
Get Started
Energy And Finance Sustainability In The Energy Industry
Authors: André Dorsman, Özgür Arslan-Ayaydin, Mehmet Baha Karan
1st Edition