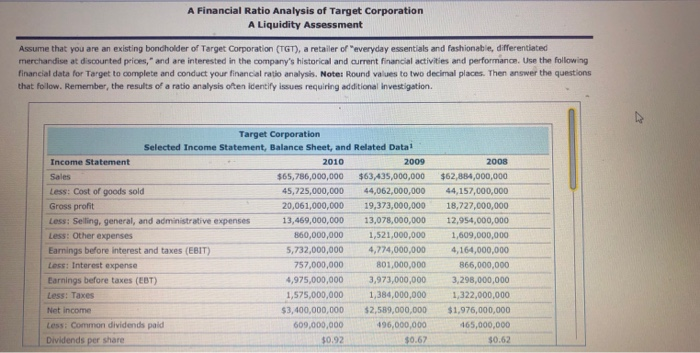
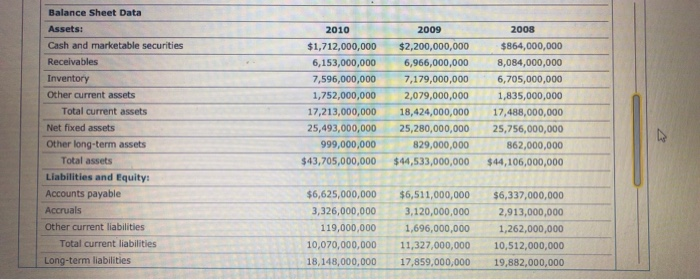
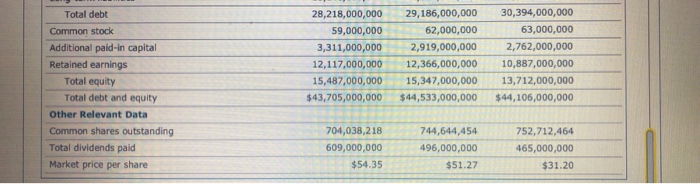
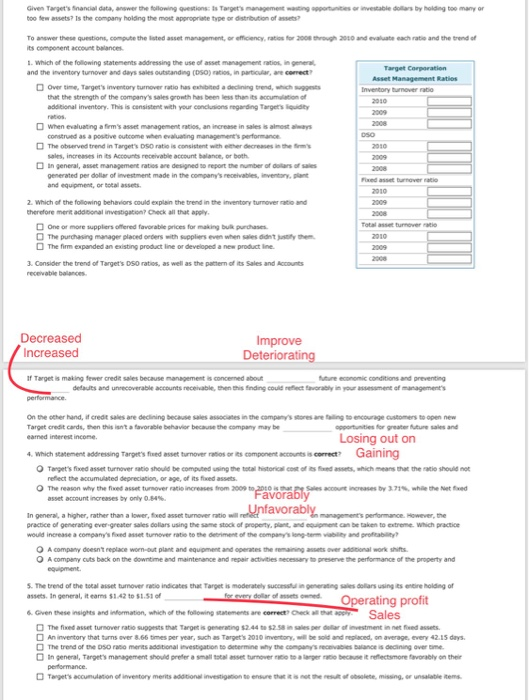
A Financial Ratio Analysis of Target Corporation A Liquidity Assess ment Assume that you are an existing bondholder of Target Corporation (TGT), a retailer of "everyday essentials and fashionable, differentiated merchandise at discournted prices," and are interested in the company's historical and current financial activities and performance. Use the following financial data for Target to complete and conduct your financial ratio analysis, Note: Round values to two decimal places. Then answer the questions that follow. Remember, the results of a ratio analysis often identify issues requiring additional investigation. Target Corporation Selected Income Statement, Balance Sheet, and Related Datal 2008 Income Statement 2010 2009 Sales $65,786,000,000 $63,435,000,000 $62,884,000,000 44,062,000,000 Less: Cost of goods sold 45,725,000,000 44,157,000,000 Gross profit 20,061,000,000 19,373,000,000 18,727,000,000 Less: Selling, general, and administrative expenses 13,469,000,000 13,078,000,000 12,954,000,000 860,000,000 Less: Other expenses 1,521,000,000 1,609,000,000 Earnings before interest and taxes (EBIT) 5,732,000,000 4,774,000,000 4,164,000,000 Less: Interest expense 757,000,000 801,000,000 866,000,000 Earnings before taxes (EBT) 4,975,000,000 3,973,000,000 3.298.000,000 1,575,000,000 1,384,000,000 1,322,000,000 Less: Taxes $3,400,000,000 $1,976,000,000 Net income $2,589,000,000 Less: Common dividends paid 609,000,000 496,000,000 465,000,000 Dividends per share 0.92 $0.67 $0.62 Balance Sheet Data 2008 Assets: 2010 2009 Cash and marketable securities $1,712,000,000 $864,000,000 $2,200,000,000 Receivables 6,153,000,000 6,966,000,000 8,084,000,000 Inventory 7,596,000,000 7,179,000,000 6,705,000,000 Other current assets 1,752,000,000 2,079,000,000 1,835,000,000 Total current assets 17,213,000,000 18,424,000,000 17,488,000,000 Net fixed assets 25,493,000,000 25,280,000,000 25,756,000,000 Other long-term assets 999,000,000 829,000,000 862,000,000 Total assets $43,705,000,000 $44,533,000,000 $44,106,000,000 Liabilities and Equity: Accounts payable $6,625,000,000 $6,511,000,000 $6,337,000,000 Accruals 3,326,000,000 3,120,000,000 2,913,000,000 Other current liabilities Total current liabilities 119,000,000 1,696,000,000 1,262,000,000 10,070,000,000 11,327,000,000 10,512,000,000 Long-term liabilities 18,148,000,000 17,859,000,000 19,882,000,000 30,394,000,000 28,218,000,000 29,186,000,000 Total debt 63,000,000 62,000,000 Common stock 59,000,000 Additional paid-in capital 2,762,000,000 2,919,000,000 3,311,000,000 Retained earnings 12,117,000,000 12,366,000,000 10,887,000,000 Total equity 15,487,000,000 15,347,000,000 13,712,000,000 Total debt and equity $43,705,000,000 $44,106,000,000 $44,533,000,000 Other Relevant Data Common shares outstanding 744,644,454 704,038,218 752,712,464 Total dividends paid 496,000,000 609,000,000 465,000,000 Market price per share $54.35 $51.27 $31.20 Given Target's financial data, answer the following questions: ts Target's management wasting apportunities or investable dollars by holding too many or too few assets? Is the company holding the most appropriate type or distribution of assets? To answer these questions, compute the lsted asset management, or efficiency, ratios for 2008 through 2010 and evaluate each ratio and the trend of its component account balances 1Which of the following statements addressing the use of asset management ratios, in general Target Corparation and the inventory turnover and days sales outstanding (DSo) ratios, in particular, are cormect? Asset Management Ratios Over time, Target's inventory turnover ratio has exhibited a declining trend, which suggests gea that the strength of the company's sales growth has been less than its accumulation of Inventory turnover ratio 2010 additional inventory. This is consistent with your conclusions regarding Target's liquidity ratios When evaluating a firm's asset management ratios, an increase in sales is almost always construed as a positive outcome when evaluating management's performmance The observed trend in Target's DSO ratio is consistent with ether decreases in the rm's 2009 2008 oso 2010 sales, increases in its Accounts receivable account balance, or both 2009 in general, asset management ratios are designed to report the number of dullars of sales 2008 generated per dollar of investment made in the company's receivables, inventory, plant Fixed asset turnover ratio and equipment, or total assets. 2010 2. Which of the following behaviors could explain the trend in the inventory turnover ratio and 2009 therefore merit addibonal investigation? Check all that apply. 2008 One or more supplers offered favorable prices for making bulk purchases The purchasing manager placed orders with suppliers even when sales didnt Justity them The firm expanded an existing product line or developed a new product line. Total asset turnover ratio 2010 2009 2008 3. Consider the trend of Target's DSO ratios, as well as the pattern of its Sales and Accounts receivable balances Decreased Increased Improve Deteriorating if Target is making fewer credit sales because management is concemed about future economic conditions and preventing defaults and unrecoverable accounts receivable, then this finding could reflect favorably in your assessment of management's performance. On the other hand, if credit sales are declining because sales associates in the company's stores are failing to encourage customers to open new Target credit cards, then this isn't a favorable behavior because the company may be opportunities for greater future sales and Losing out on Gaining earmed interest income. 4. Which statement addressing Target's fixed asset turnover ratios or its component accounts is correct? O Target's fixed asset turnover satio should be computed using the total historical cost of its fixed assets, which means that the ratio should not reflect the accumulated depreciation, or age, of its fixed assets. O The reason why the fixed asset turnover ratio increases from 2009 to, 2010 is that e Sales account increases by 3.71%, whle the Net fxed Favorably asset account increases by only 0.84% nfavorably In general, a higher, rather than a lower, fixed asset turnover ratio will re practice of generating ever-greater sales dolars using the same stock of property, plant, and equipment can be taken to extreme. Which practice management's performance. However, the would increase a company's fixed asset turnover ratio to the detriment of the company's long-tem viability and profitability O A company desn't replace worn-out plant and equipment and operates the remaining assets over additional work shifts O A company cuts back on the downtime and maintenance and repair activities necessary to preserve the performance of the property and equipment. S. The trend of the total asset tunover ratio indicates that Target is moderately successtul in generating sales dollars using its entire holding of for every dollar of assets owned assets. In general, it eams $1.42 to $1.51 of Operating profit Sales 6 Given these insightes and information, which of the following statements are correct? Check all that appy The fixed asset turnover ratio suppests that Target is generating $2.44 to $2.58 in sales per dellar of investment in net fieed assets. An inventory that turns over 8.66 times per year, such as Target's 2010 inventory, will be sold and replaced, on average, every 42.15 days The trend of the Dso raso merits additional investigation to determine why the company's recevables balance is decining over time. in general, Target's management should prefer a small total asset turnover ratio to a larger ratio because it reffectsmore favorably on their peformance. Tanget's accumulation of inventory merits additional investigation to ensure that it is not the result of obsolete, missing, or unsalable items A Financial Ratio Analysis of Target Corporation A Liquidity Assess ment Assume that you are an existing bondholder of Target Corporation (TGT), a retailer of "everyday essentials and fashionable, differentiated merchandise at discournted prices," and are interested in the company's historical and current financial activities and performance. Use the following financial data for Target to complete and conduct your financial ratio analysis, Note: Round values to two decimal places. Then answer the questions that follow. Remember, the results of a ratio analysis often identify issues requiring additional investigation. Target Corporation Selected Income Statement, Balance Sheet, and Related Datal 2008 Income Statement 2010 2009 Sales $65,786,000,000 $63,435,000,000 $62,884,000,000 44,062,000,000 Less: Cost of goods sold 45,725,000,000 44,157,000,000 Gross profit 20,061,000,000 19,373,000,000 18,727,000,000 Less: Selling, general, and administrative expenses 13,469,000,000 13,078,000,000 12,954,000,000 860,000,000 Less: Other expenses 1,521,000,000 1,609,000,000 Earnings before interest and taxes (EBIT) 5,732,000,000 4,774,000,000 4,164,000,000 Less: Interest expense 757,000,000 801,000,000 866,000,000 Earnings before taxes (EBT) 4,975,000,000 3,973,000,000 3.298.000,000 1,575,000,000 1,384,000,000 1,322,000,000 Less: Taxes $3,400,000,000 $1,976,000,000 Net income $2,589,000,000 Less: Common dividends paid 609,000,000 496,000,000 465,000,000 Dividends per share 0.92 $0.67 $0.62 Balance Sheet Data 2008 Assets: 2010 2009 Cash and marketable securities $1,712,000,000 $864,000,000 $2,200,000,000 Receivables 6,153,000,000 6,966,000,000 8,084,000,000 Inventory 7,596,000,000 7,179,000,000 6,705,000,000 Other current assets 1,752,000,000 2,079,000,000 1,835,000,000 Total current assets 17,213,000,000 18,424,000,000 17,488,000,000 Net fixed assets 25,493,000,000 25,280,000,000 25,756,000,000 Other long-term assets 999,000,000 829,000,000 862,000,000 Total assets $43,705,000,000 $44,533,000,000 $44,106,000,000 Liabilities and Equity: Accounts payable $6,625,000,000 $6,511,000,000 $6,337,000,000 Accruals 3,326,000,000 3,120,000,000 2,913,000,000 Other current liabilities Total current liabilities 119,000,000 1,696,000,000 1,262,000,000 10,070,000,000 11,327,000,000 10,512,000,000 Long-term liabilities 18,148,000,000 17,859,000,000 19,882,000,000 30,394,000,000 28,218,000,000 29,186,000,000 Total debt 63,000,000 62,000,000 Common stock 59,000,000 Additional paid-in capital 2,762,000,000 2,919,000,000 3,311,000,000 Retained earnings 12,117,000,000 12,366,000,000 10,887,000,000 Total equity 15,487,000,000 15,347,000,000 13,712,000,000 Total debt and equity $43,705,000,000 $44,106,000,000 $44,533,000,000 Other Relevant Data Common shares outstanding 744,644,454 704,038,218 752,712,464 Total dividends paid 496,000,000 609,000,000 465,000,000 Market price per share $54.35 $51.27 $31.20 Given Target's financial data, answer the following questions: ts Target's management wasting apportunities or investable dollars by holding too many or too few assets? Is the company holding the most appropriate type or distribution of assets? To answer these questions, compute the lsted asset management, or efficiency, ratios for 2008 through 2010 and evaluate each ratio and the trend of its component account balances 1Which of the following statements addressing the use of asset management ratios, in general Target Corparation and the inventory turnover and days sales outstanding (DSo) ratios, in particular, are cormect? Asset Management Ratios Over time, Target's inventory turnover ratio has exhibited a declining trend, which suggests gea that the strength of the company's sales growth has been less than its accumulation of Inventory turnover ratio 2010 additional inventory. This is consistent with your conclusions regarding Target's liquidity ratios When evaluating a firm's asset management ratios, an increase in sales is almost always construed as a positive outcome when evaluating management's performmance The observed trend in Target's DSO ratio is consistent with ether decreases in the rm's 2009 2008 oso 2010 sales, increases in its Accounts receivable account balance, or both 2009 in general, asset management ratios are designed to report the number of dullars of sales 2008 generated per dollar of investment made in the company's receivables, inventory, plant Fixed asset turnover ratio and equipment, or total assets. 2010 2. Which of the following behaviors could explain the trend in the inventory turnover ratio and 2009 therefore merit addibonal investigation? Check all that apply. 2008 One or more supplers offered favorable prices for making bulk purchases The purchasing manager placed orders with suppliers even when sales didnt Justity them The firm expanded an existing product line or developed a new product line. Total asset turnover ratio 2010 2009 2008 3. Consider the trend of Target's DSO ratios, as well as the pattern of its Sales and Accounts receivable balances Decreased Increased Improve Deteriorating if Target is making fewer credit sales because management is concemed about future economic conditions and preventing defaults and unrecoverable accounts receivable, then this finding could reflect favorably in your assessment of management's performance. On the other hand, if credit sales are declining because sales associates in the company's stores are failing to encourage customers to open new Target credit cards, then this isn't a favorable behavior because the company may be opportunities for greater future sales and Losing out on Gaining earmed interest income. 4. Which statement addressing Target's fixed asset turnover ratios or its component accounts is correct? O Target's fixed asset turnover satio should be computed using the total historical cost of its fixed assets, which means that the ratio should not reflect the accumulated depreciation, or age, of its fixed assets. O The reason why the fixed asset turnover ratio increases from 2009 to, 2010 is that e Sales account increases by 3.71%, whle the Net fxed Favorably asset account increases by only 0.84% nfavorably In general, a higher, rather than a lower, fixed asset turnover ratio will re practice of generating ever-greater sales dolars using the same stock of property, plant, and equipment can be taken to extreme. Which practice management's performance. However, the would increase a company's fixed asset turnover ratio to the detriment of the company's long-tem viability and profitability O A company desn't replace worn-out plant and equipment and operates the remaining assets over additional work shifts O A company cuts back on the downtime and maintenance and repair activities necessary to preserve the performance of the property and equipment. S. The trend of the total asset tunover ratio indicates that Target is moderately successtul in generating sales dollars using its entire holding of for every dollar of assets owned assets. In general, it eams $1.42 to $1.51 of Operating profit Sales 6 Given these insightes and information, which of the following statements are correct? Check all that appy The fixed asset turnover ratio suppests that Target is generating $2.44 to $2.58 in sales per dellar of investment in net fieed assets. An inventory that turns over 8.66 times per year, such as Target's 2010 inventory, will be sold and replaced, on average, every 42.15 days The trend of the Dso raso merits additional investigation to determine why the company's recevables balance is decining over time. in general, Target's management should prefer a small total asset turnover ratio to a larger ratio because it reffectsmore favorably on their peformance. Tanget's accumulation of inventory merits additional investigation to ensure that it is not the result of obsolete, missing, or unsalable items