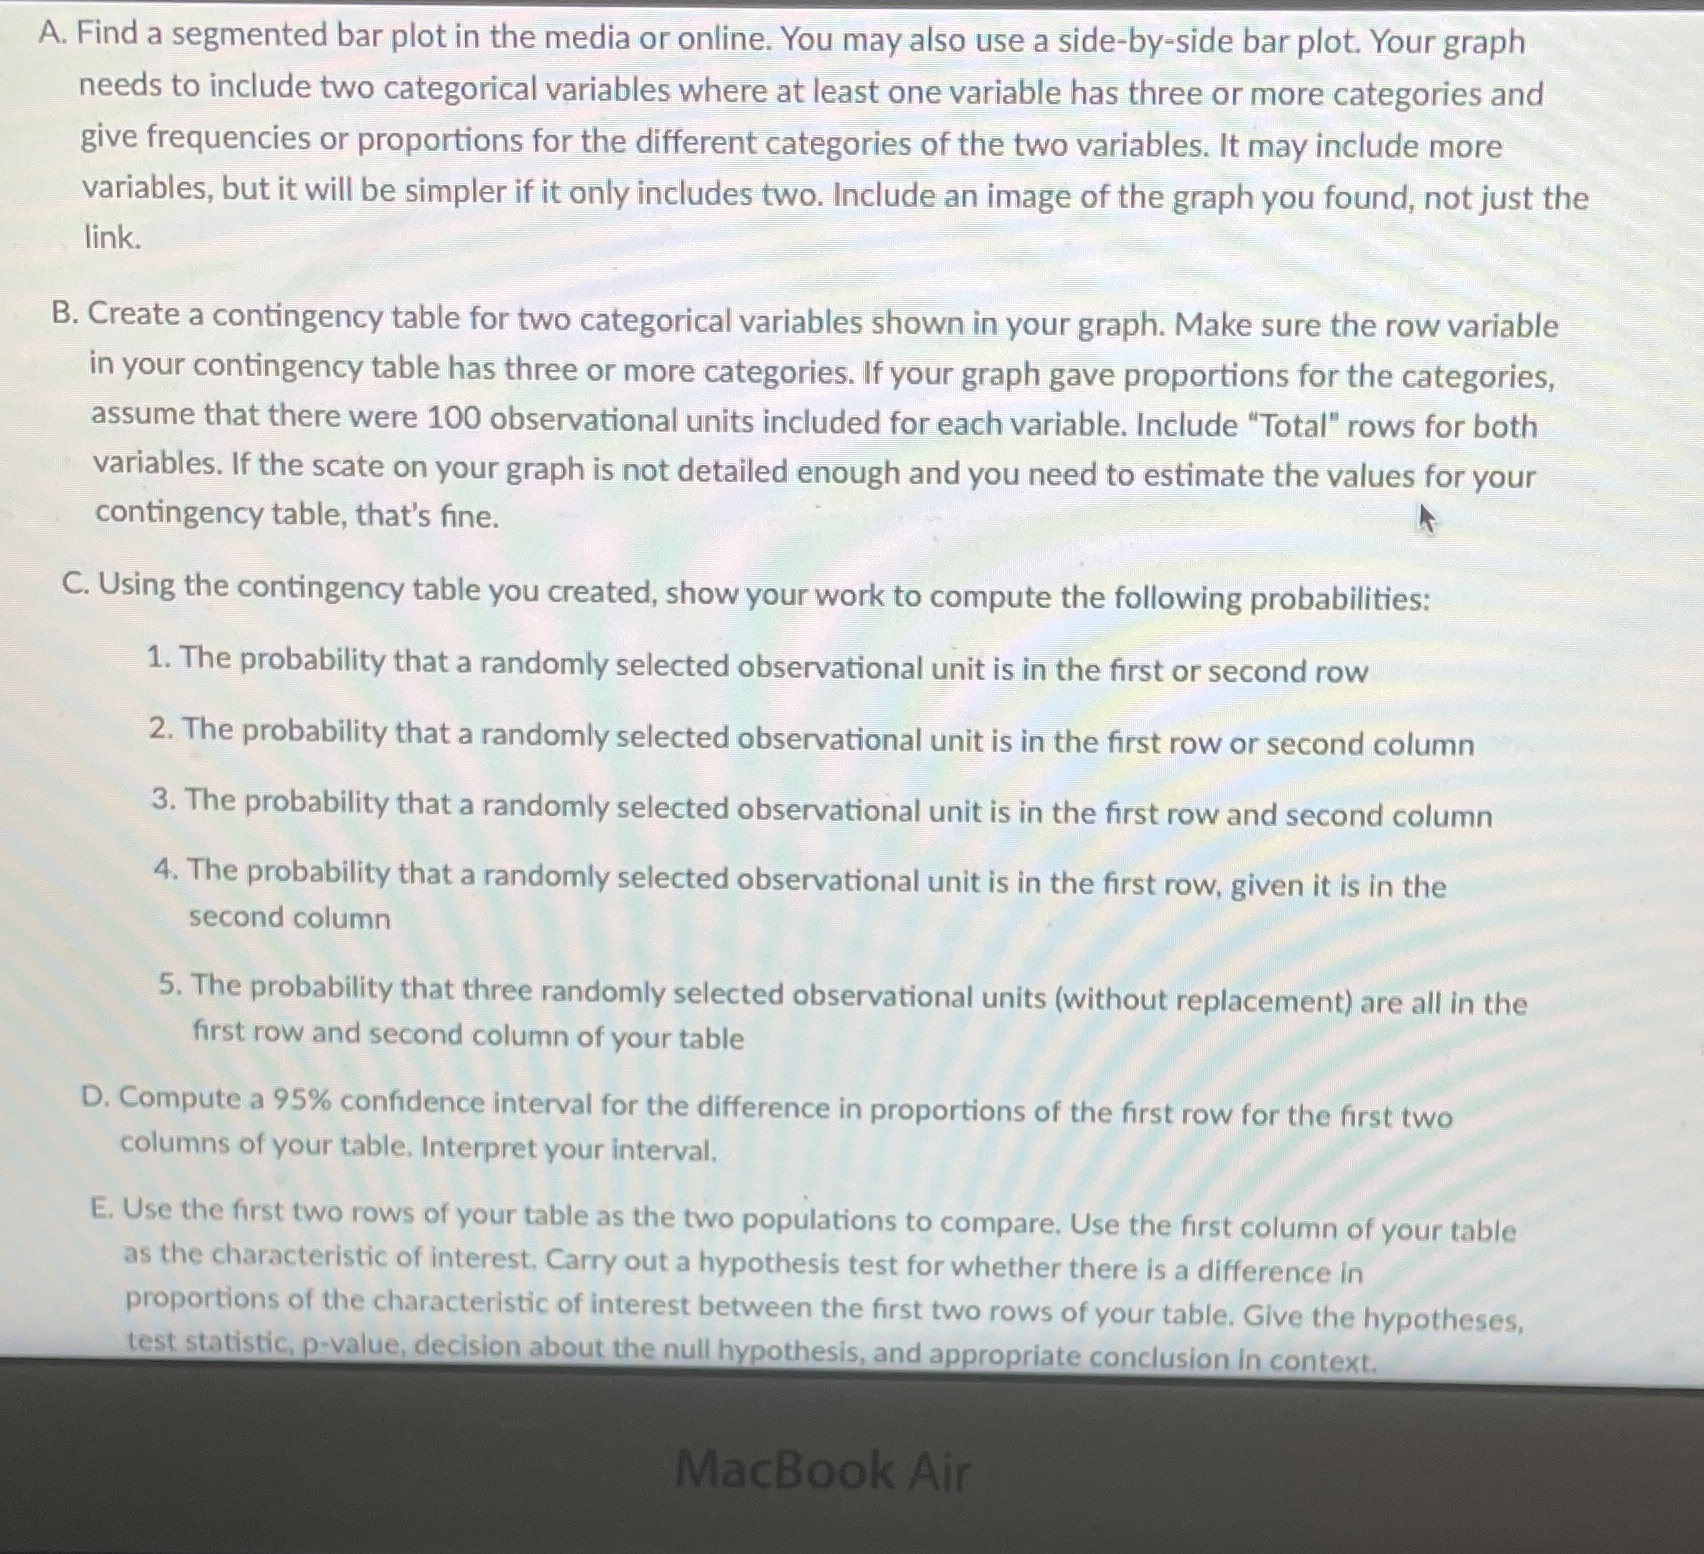
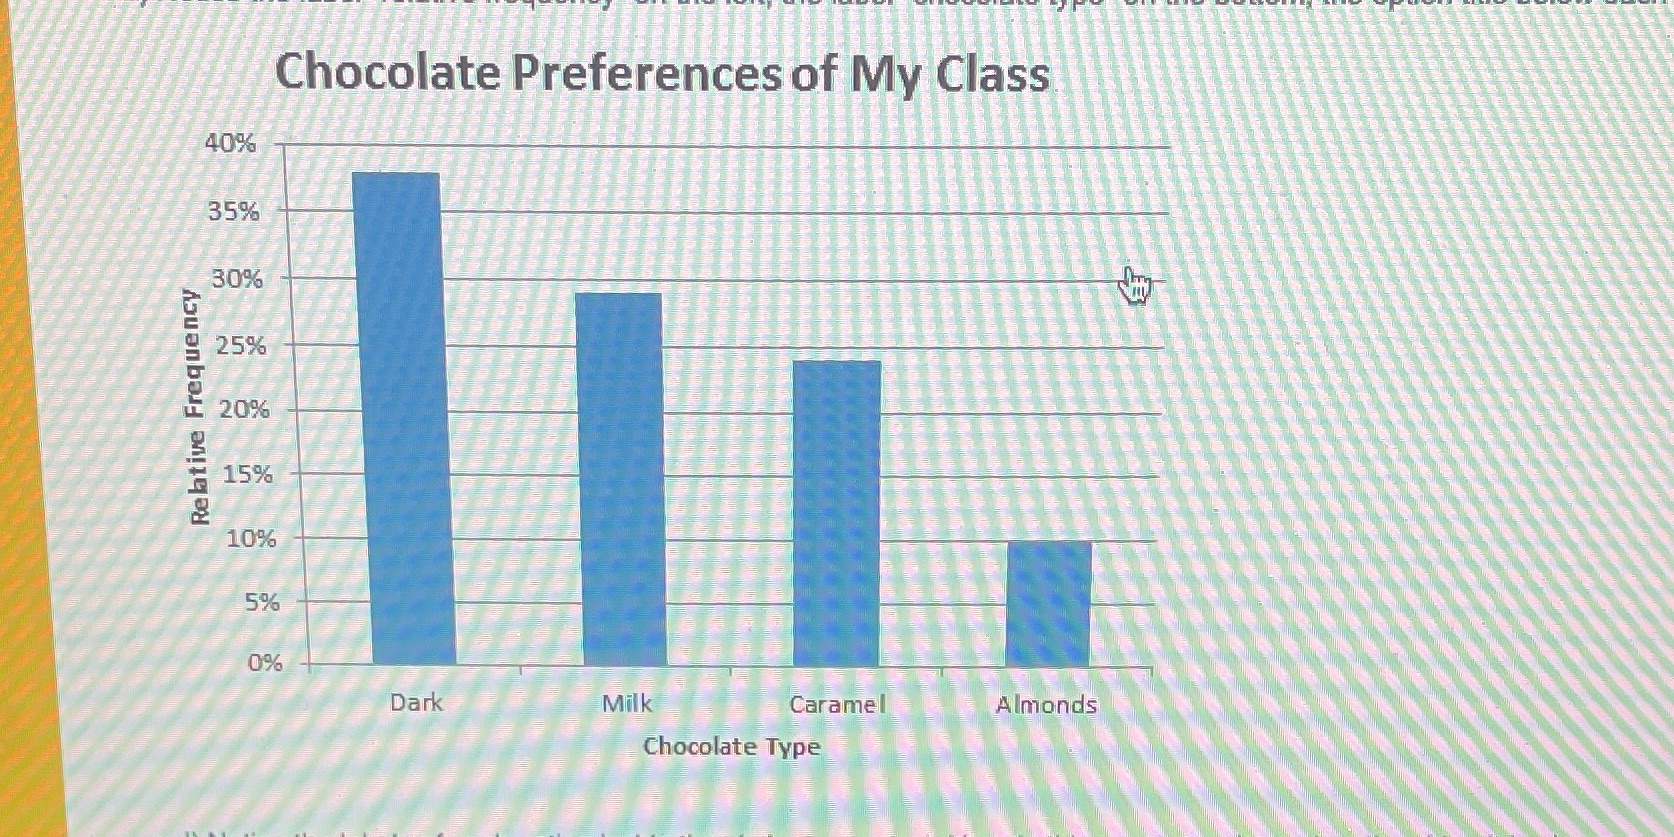
A. Find a segmented bar plot in the media or online. You may also use a side-by-side bar plot. Your graph needs to include two categorical variables where at least one variable has three or more categories and give frequencies or proportions for the different categories of the two variables. It may include more variables, but it will be simpler if it only includes two. Include an image of the graph you found, not just the link. B. Create a contingency table for two categorical variables shown in your graph. Make sure the row variable in your contingency table has three or more categories. If your graph gave proportions for the categories, assume that there were 100 observational units included for each variable. Include "Total" rows for both variables. If the scate on your graph is not detailed enough and you need to estimate the values for your contingency table, that's fine. C. Using the contingency table you created, show your work to compute the following probabilities: 1. The probability that a randomly selected observational unit is in the first or second row 2. The probability that a randomly selected observational unit is in the first row or second column 3. The probability that a randomly selected observational unit is in the first row and second column 4. The probability that a randomly selected observational unit is in the first row, given it is in the second column 5. The probability that three randomly selected observational units (without replacement) are all in the first row and second column of your table D. Compute a 95% confidence interval for the difference in proportions of the first row for the first two columns of your table, Interpret your interval. E. Use the first two rows of your table as the two populations to compare. Use the first column of your table as the characteristic of interest. Carry out a hypothesis test for whether there is a difference in proportions of the characteristic of interest between the first two rows of your table. Give the hypotheses, test statistic, p-value, decision about the null hypothesis, and appropriate conclusion in context. MacBook AirChocolate Preferences of My Class 40% 35% 30% 25% Relative Frequency 20% 15% 10% 5% 0% Dark Milk Caramel Almonds Chocolate Type


