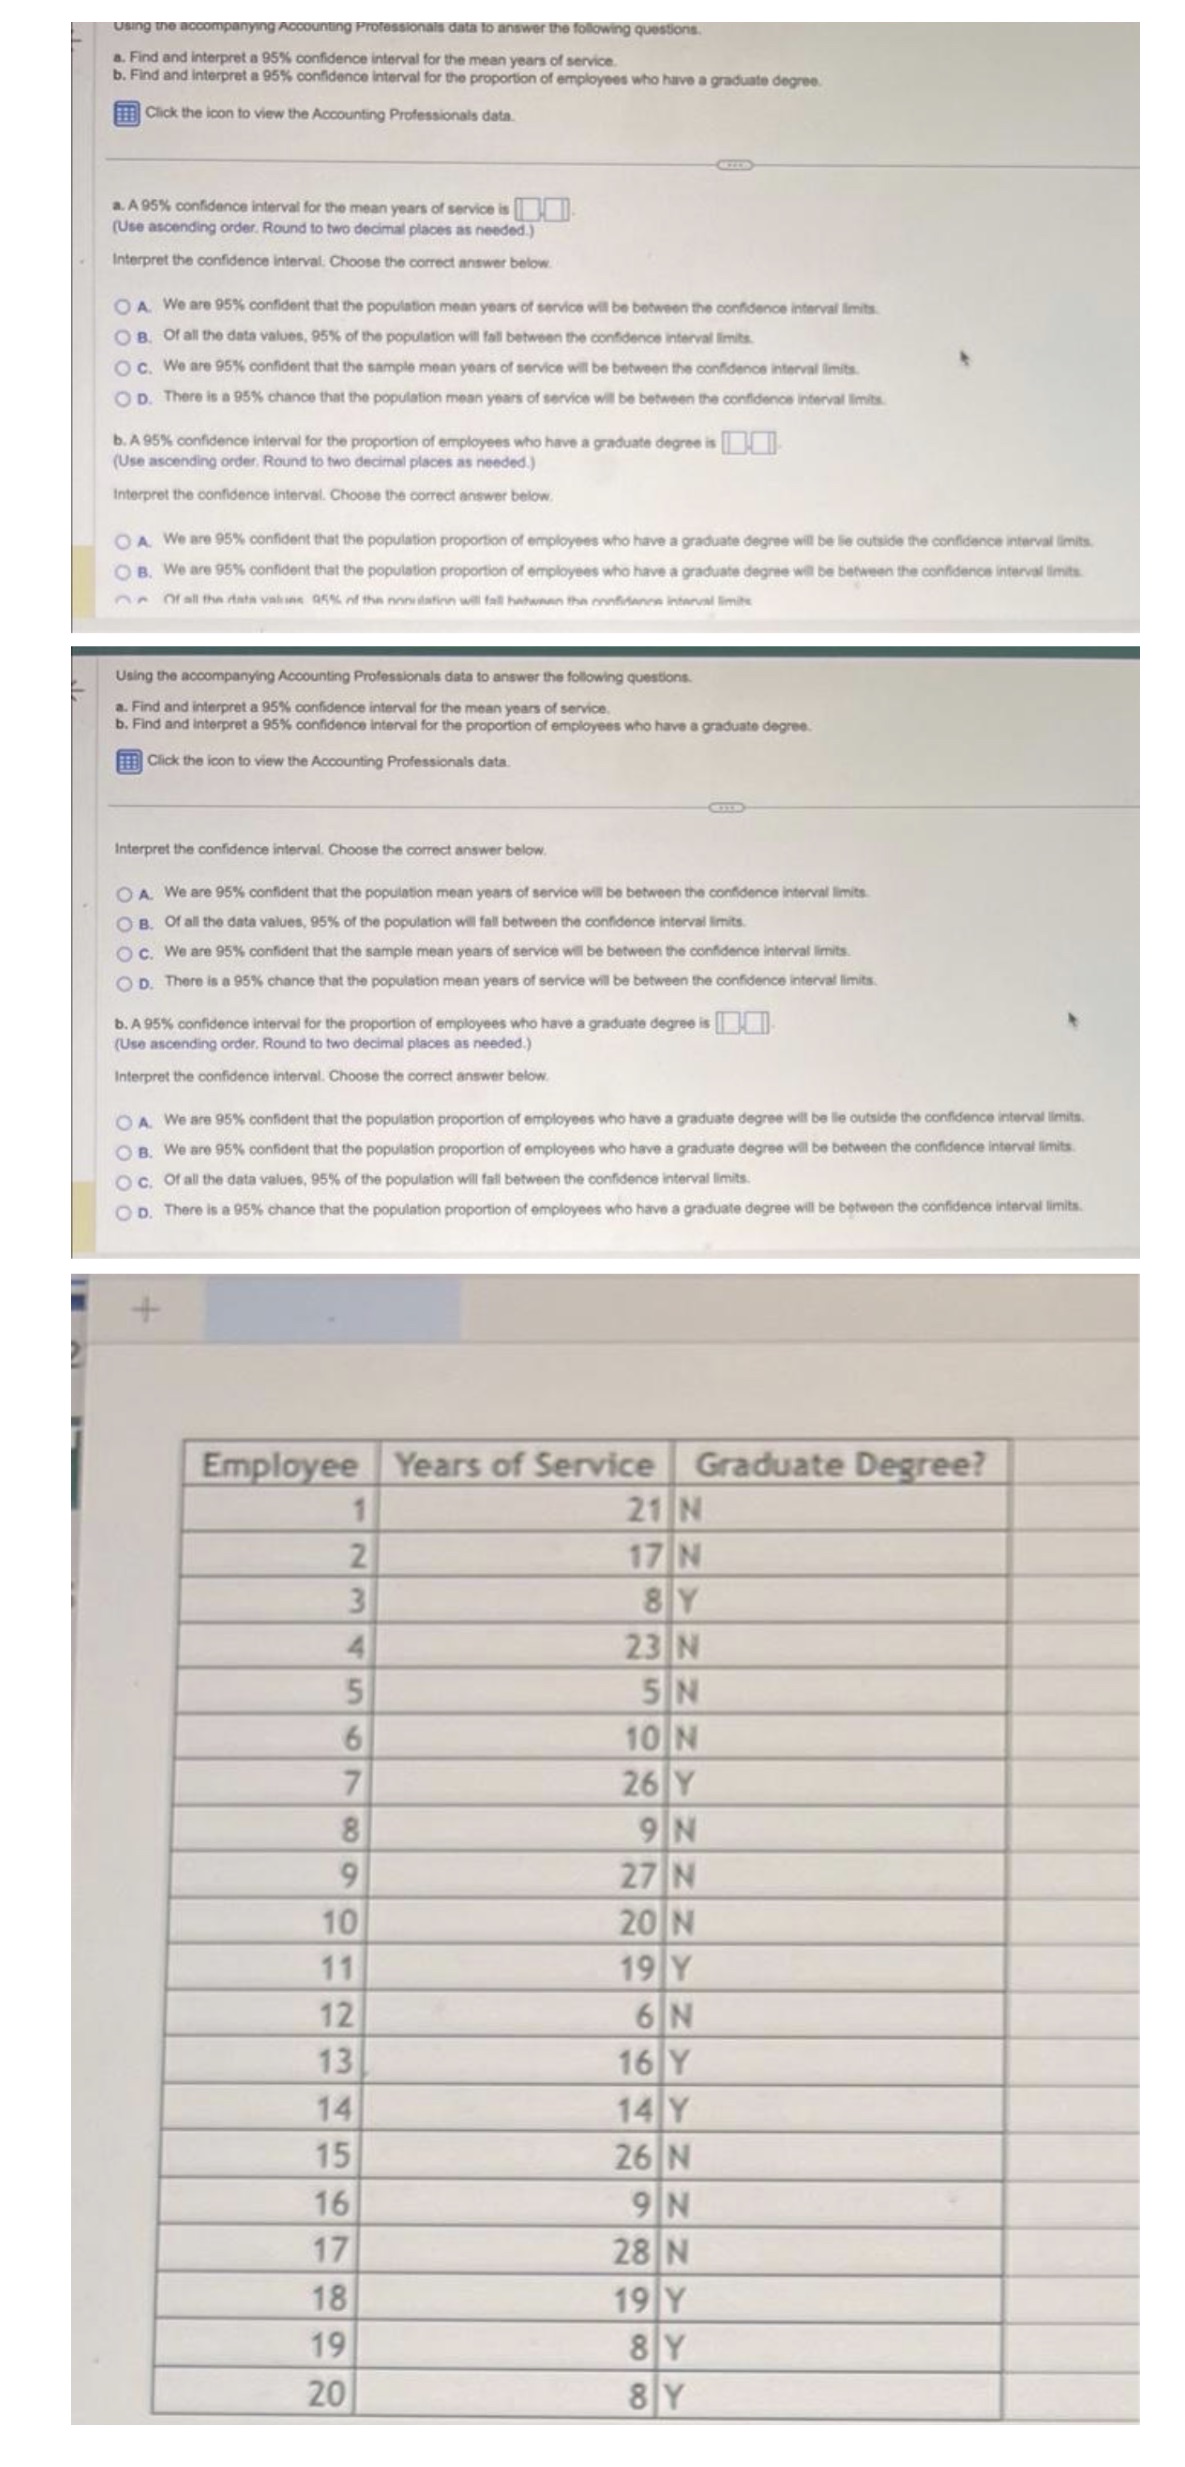
a. Find and interpret a 95% confidence interval for the mean years of service. b. Find and interpret a 95% confidence nterval for the proportion of employees who have a graduate degree Click the icon to view the Accounting Professionals data. a. A 95% confidence interval for the mean years of service is (Use ascending order. Round to two decimal places as needed.) Interpret the confidence interval. Choose the correct answer b A. We are 95% confident that the population mean years of service will be between the confidence interval limits B. Of all the data values, 95% of the population will fall between the confidence interval limits. C. We are 95%% confident that the sample mean years of service will be between the confidence interval limits. D. There is a 95% chance that the population mean years of service will be between the confidence interval limits. b. A 95% confidence interval for the propor ees who have a graduate degree is (Use ascending order, Round to to Interpret the con Choose the correct answer below. A. We are 95% confident that the population proportion of employees who have a graduate degree will be lie outside the confidence interval limits. B. We are 95% confident that the population proportion of employees es who have a graduate degree wil be between the confidence interval limits. Or Of all the state valuone 95% of the nomination will fall hatwon the confidence interval limits Using the accompanying Accounting Professionals data to answer the following questions. a. Find and interpret a 95% confidence interval for the mean years of service, b. Find and interpret a 95% confidence val for the proportion of employees who have a graduate degree. Click the icon to view the Accounting Professionals data. CD Interpret the confidence interval. Choose the correct answer below. A. We are 95% confident that the population mean years of service will be between the confidence interval limits. O B. Of all the data values, 95% of the population will fall between the confidence interval limits. c. We are 95% confident that the sample mean years of service will be bet sen the confidence interval limits. D. There is a 95% chance that the population mean years of service will be between the confidence interval limits. b. A 95% confidence interval for the proportion of employees who have a graduate degree is ] (Use ascending order, Round to two decimal places as needed.) Interpret the confidence interval. Choose the correct answer below. A. We are 95% confident that the population proportion of employees who have a graduate degree will be lie outside the confidence interval limits. O B. We are 95%% confident that the pop employees who have a graduate degree will be between the confidence interval limits. O c. Of all the data values, 95% of the population will fall between O D. There is a 95% chance that the population proportion of employees who have a graduate degree will tween the confidence interval limits 4- Employee Years of Service | Graduate Degree? 1 21 N 2 17 N w 8 Y 23 N 5 N 10 N 26 Y 9 N 27 N 10 20 N 11 19 Y 12 6 N 13 16 Y 14 14 Y 15 26 N 16 9 N 17 28 N 18 19 Y 19 8 Y 20 8 Y