Answered step by step
Verified Expert Solution
Link Copied!

Question

1 Approved Answer

a) Finish the calculation of the last six moving ranges, and plot them on the graph provided. b) Calculate the centerline for the moving range
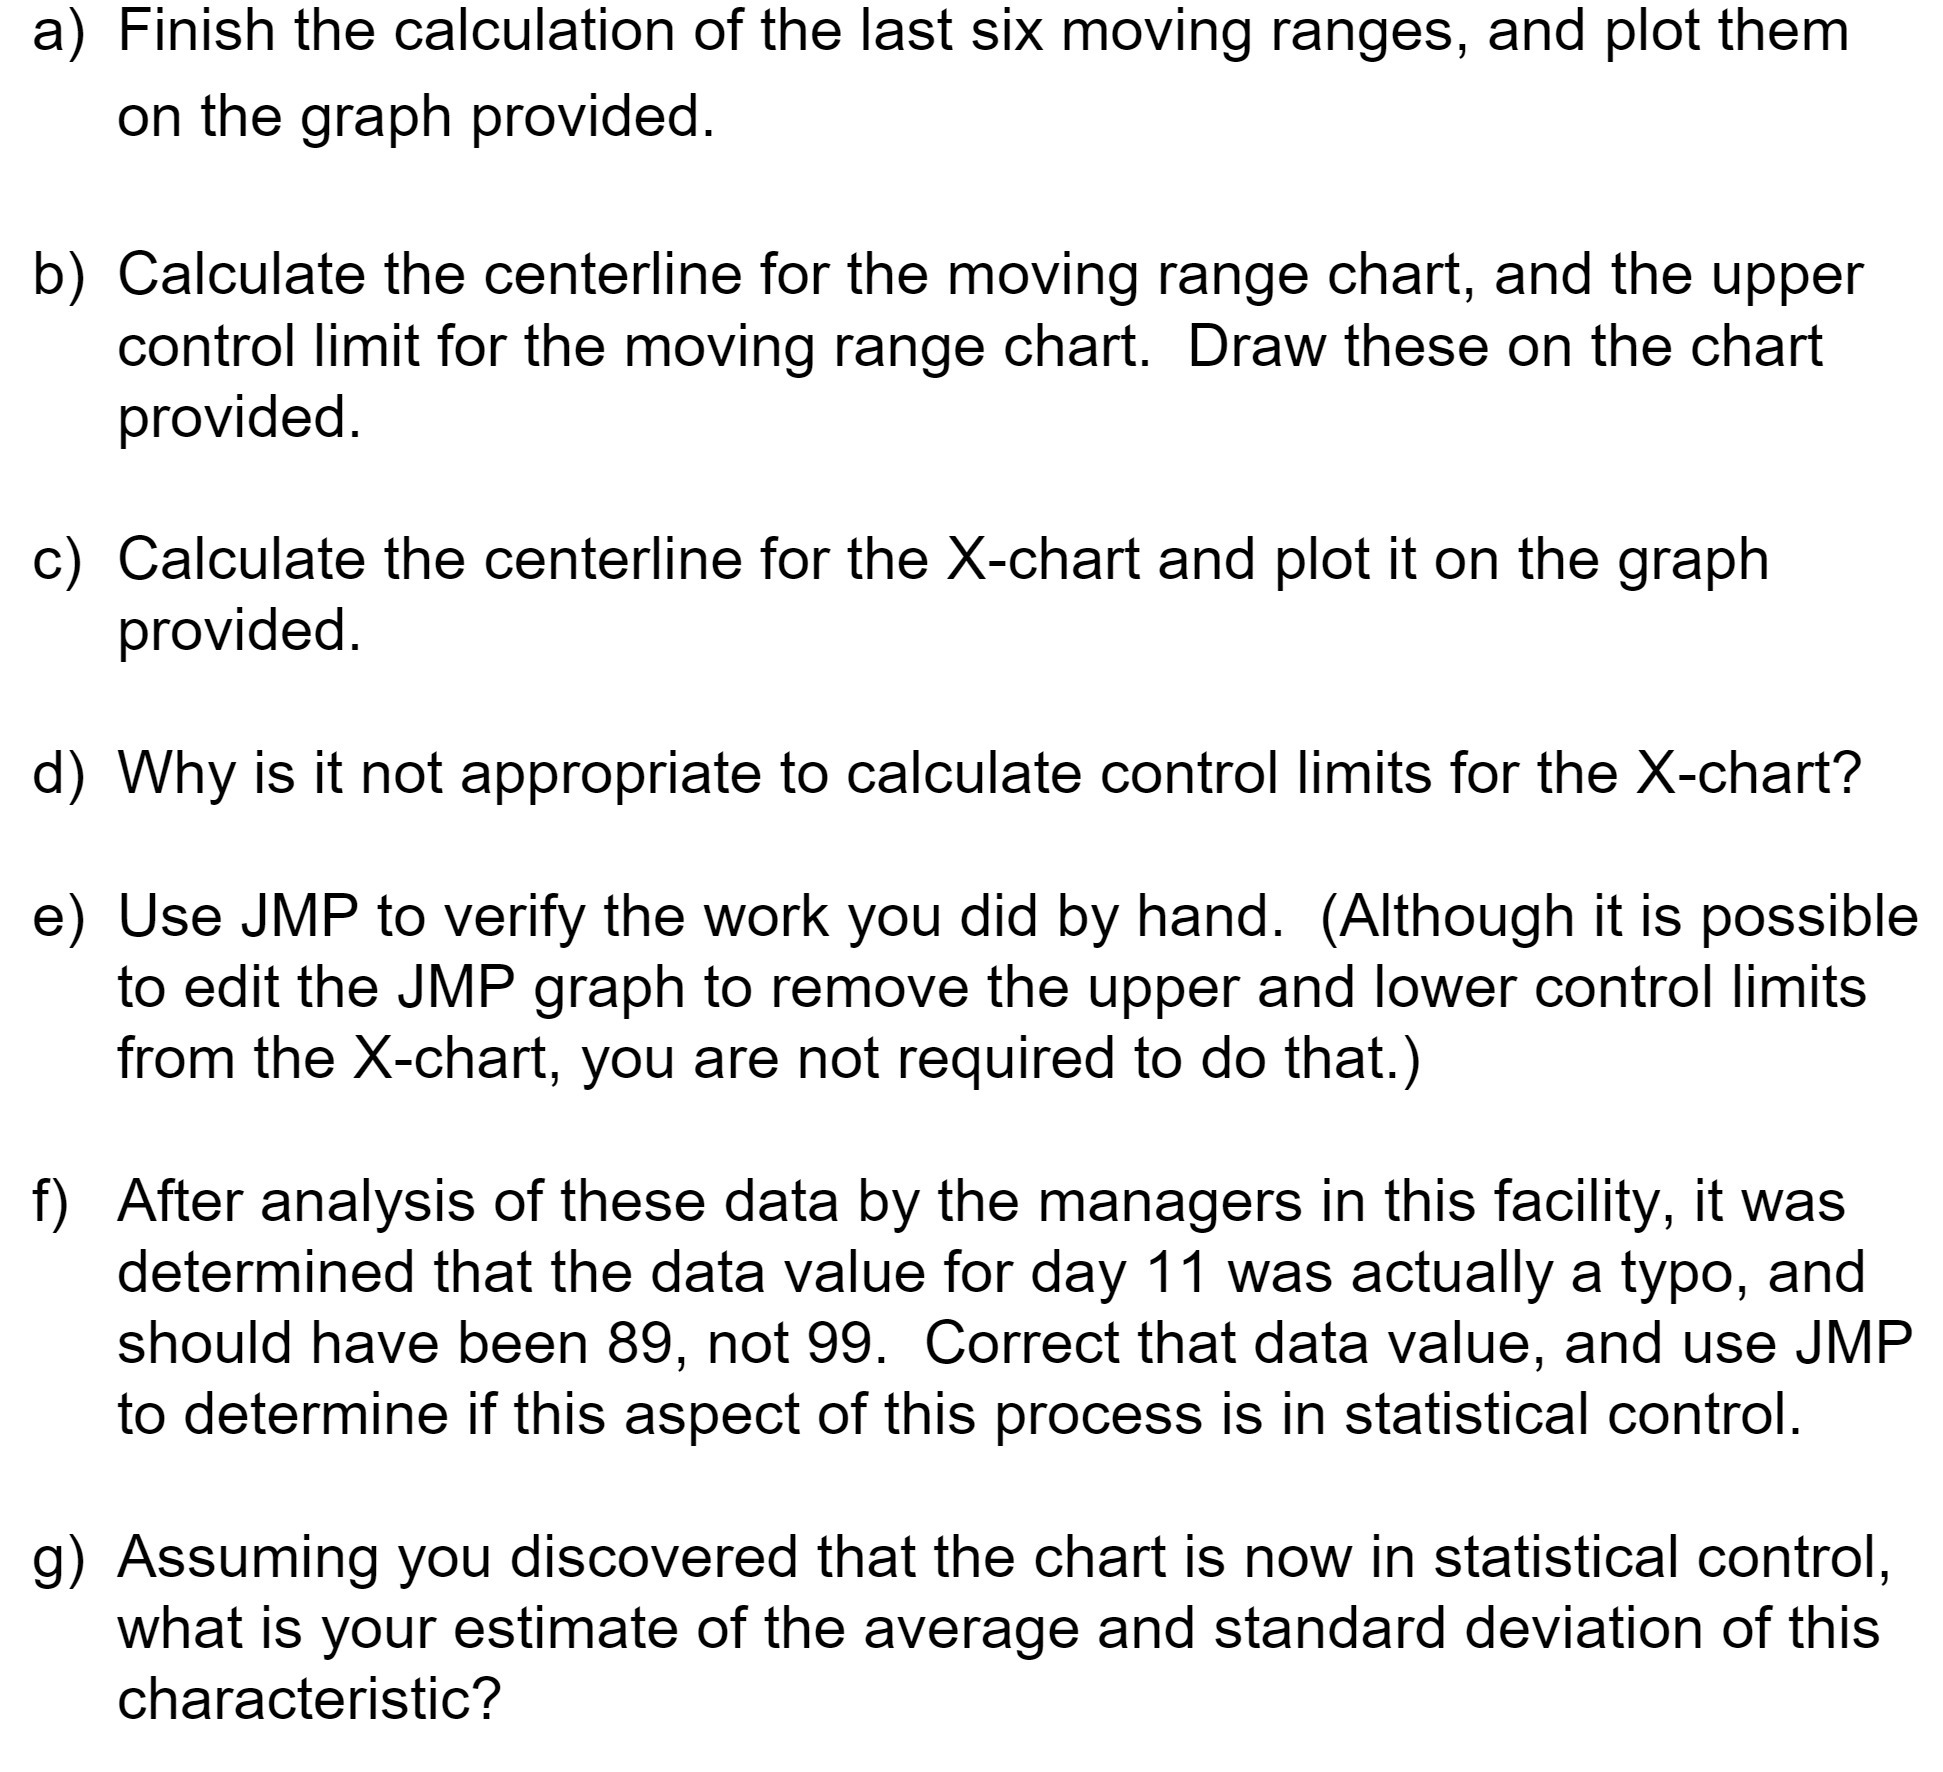
image text in transcribed
a) Finish the calculation of the last six moving ranges, and plot them on the graph provided. b) Calculate the centerline for the moving range chart, and the upper control limit for the moving range chart. Draw these on the chart provided. 0) Calculate the centerline for the X-chart and plot it on the graph provided. d) Why is it not appropriate to calculate control limits for the X-chart? e) Use JMP to verify the work you did by hand. (Although it is possible to edit the JMP graph to remove the upper and lower control limits from the X-chart, you are not required to do that.) f) After analysis of these data by the managers in this facility, it was determined that the data value for day 11 was actually a typo, and should have been 89, not 99. Correct that data value, and use JMP to determine if this aspect of this process is in statistical control. 9) Assuming you discovered that the chart is now in statistical control, what is your estimate of the average and standard deviation of this characteristic

Step by Step Solution

There are 3 Steps involved in it

Step: 1

blur-text-image

Get Instant Access to Expert-Tailored Solutions

See step-by-step solutions with expert insights and AI powered tools for academic success

Step: 2

blur-text-image_2

Step: 3

blur-text-image_3

Ace Your Homework with AI

Get the answers you need in no time with our AI-driven, step-by-step assistance

Get Started

Recommended Textbook for

Advanced Engineering Mathematics

Authors: Erwin Kreyszig

7th Edition

471553808, 978-0471553809

More Books

Students also viewed these Mathematics questions