Answered step by step
Verified Expert Solution
Link Copied!

Question

1 Approved Answer

A firm experienced the demand shown in the following table. Fill in the table by preparing forecasts based on a five-year moving average, a three-year
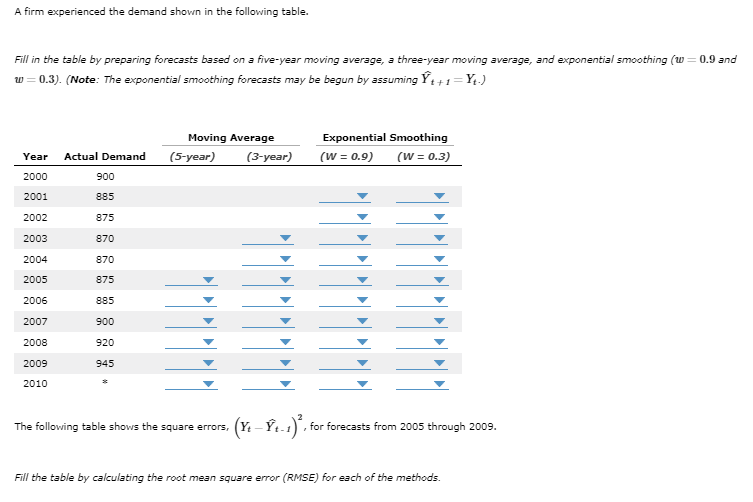
image text in transcribed

A firm experienced the demand shown in the following table. Fill in the table by preparing forecasts based on a five-year moving average, a three-year moving average, and exponential smoothing ( w = 0.9 and w=0.3 ). (Note: The exponential smoothing forecasts may be begun by assuming Y^t+1=Yt.) The following table shows the square errors, (YtY^t1)2, for forecasts from 2005 through 2009. Fill the table by calculating the root mean square error (RMSE) for each of the methods

Step by Step Solution

There are 3 Steps involved in it

Step: 1

blur-text-image

Get Instant Access to Expert-Tailored Solutions

See step-by-step solutions with expert insights and AI powered tools for academic success

Step: 2

blur-text-image

Step: 3

blur-text-image

Ace Your Homework with AI

Get the answers you need in no time with our AI-driven, step-by-step assistance

Get Started

Recommended Textbook for

Introduction to Risk Management and Insurance

Authors: Mark S. Dorfman, David Cather

10th edition

131394126, 978-0133255409, 133255409, 978-0131394124

More Books

Students also viewed these General Management questions