

Question
a. First calculate future electricity demand in years 2020-2024 assuming a median temperature (86.09 degrees F). 2020 2021 2022 2023 2023 Next calculate future electricity
a. First calculate future electricity demand in years 2020-2024 assuming a median temperature (86.09 degrees F).
2020
2021
2022
2023
2023
- Next calculate future electricity demand in each year, 2020-24, assuming a 90th percentile temperature (88.3 degrees F).
2020
2021
2022
2023
2023
If you want to have enough generation capacity to meet 2024 peak demand under a 90th percentile temperature, how much new capacity do you need to build (assuming today the system has 21 GW of firm capacity installed).
c. How much new capacity do you need in order to have a 15% reserve margin (i.e., 115% of 2024 peak demand under a 90th percentile)?
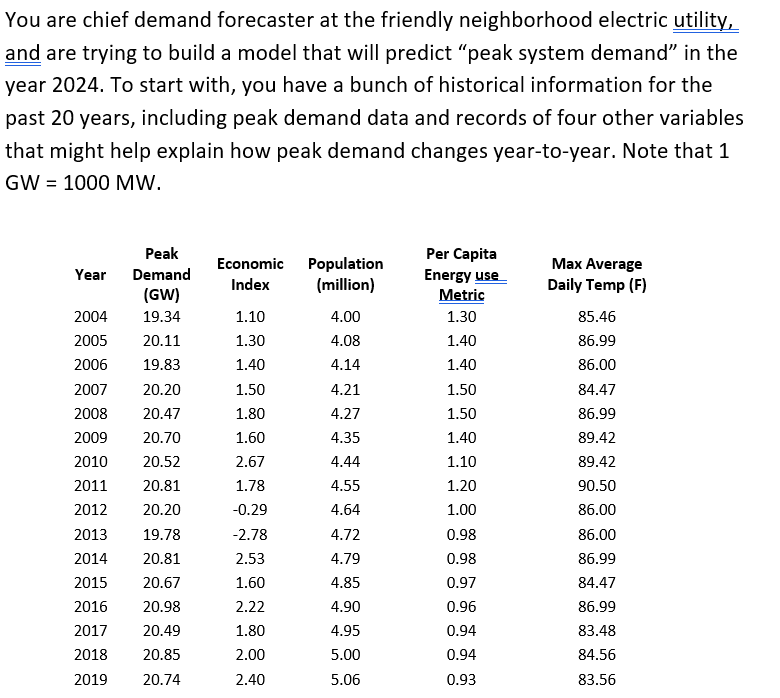
You are chief demand forecaster at the friendly neighborhood electric utility, and are trying to build a model that will predict "peak system demand" in the year 2024. To start with, you have a bunch of historical information for the past 20 years, including peak demand data and records of four other variables that might help explain how peak demand changes year-to-year. Note that 1 GW = 1000 MW. Year Economic Index Population (million) Peak Demand (GW) 19.34 20.11 19.83 20.20 20.47 1.10 1.30 1.40 1.50 Per Capita Energy use Metric 1.30 1.40 1.40 1.50 1.50 1.40 1.10 1.20 1.00 2004 2005 2006 2007 2008 2009 2010 2011 2012 2013 2014 2015 2016 2017 2018 2019 20.70 20.52 Max Average Daily Temp (F) 85.46 86.99 86.00 84.47 86.99 89.42 89.42 90.50 86.00 86.00 86.99 84.47 4.00 4.08 4.14 4.21 4.27 4.35 4.44 4.55 4.64 4.72 4.79 4.85 4.90 4.95 5.00 5.06 20.81 20.20 19.78 1.80 1.60 2.67 1.78 -0.29 -2.78 2.53 1.60 2.22 1.80 2.00 2.40 0.98 0.98 86.99 20.81 20.67 20.98 20.49 20.85 20.74 0.97 0.96 0.94 0.94 83.48 84.56 83.56 0.93 You are chief demand forecaster at the friendly neighborhood electric utility, and are trying to build a model that will predict "peak system demand" in the year 2024. To start with, you have a bunch of historical information for the past 20 years, including peak demand data and records of four other variables that might help explain how peak demand changes year-to-year. Note that 1 GW = 1000 MW. Year Economic Index Population (million) Peak Demand (GW) 19.34 20.11 19.83 20.20 20.47 1.10 1.30 1.40 1.50 Per Capita Energy use Metric 1.30 1.40 1.40 1.50 1.50 1.40 1.10 1.20 1.00 2004 2005 2006 2007 2008 2009 2010 2011 2012 2013 2014 2015 2016 2017 2018 2019 20.70 20.52 Max Average Daily Temp (F) 85.46 86.99 86.00 84.47 86.99 89.42 89.42 90.50 86.00 86.00 86.99 84.47 4.00 4.08 4.14 4.21 4.27 4.35 4.44 4.55 4.64 4.72 4.79 4.85 4.90 4.95 5.00 5.06 20.81 20.20 19.78 1.80 1.60 2.67 1.78 -0.29 -2.78 2.53 1.60 2.22 1.80 2.00 2.40 0.98 0.98 86.99 20.81 20.67 20.98 20.49 20.85 20.74 0.97 0.96 0.94 0.94 83.48 84.56 83.56 0.93Step by Step Solution
There are 3 Steps involved in it
Step: 1

Get Instant Access to Expert-Tailored Solutions
See step-by-step solutions with expert insights and AI powered tools for academic success
Step: 2

Step: 3
Ace Your Homework with AI
Get the answers you need in no time with our AI-driven, step-by-step assistance
Get Started
Audit Effectiveness Meeting The IT Challenge
Authors: Kamil Omoteso
1st Edition
1409434680, 978-1409434689