Answered step by step
Verified Expert Solution
Link Copied!

Question

1 Approved Answer

a} First, go to the United Nations National Accounts Main Aggregates Database website {httpszunstats.un.org[unsdfsnaamagbasic]. Download two data series, 'GDP at constant 2015 prices in US
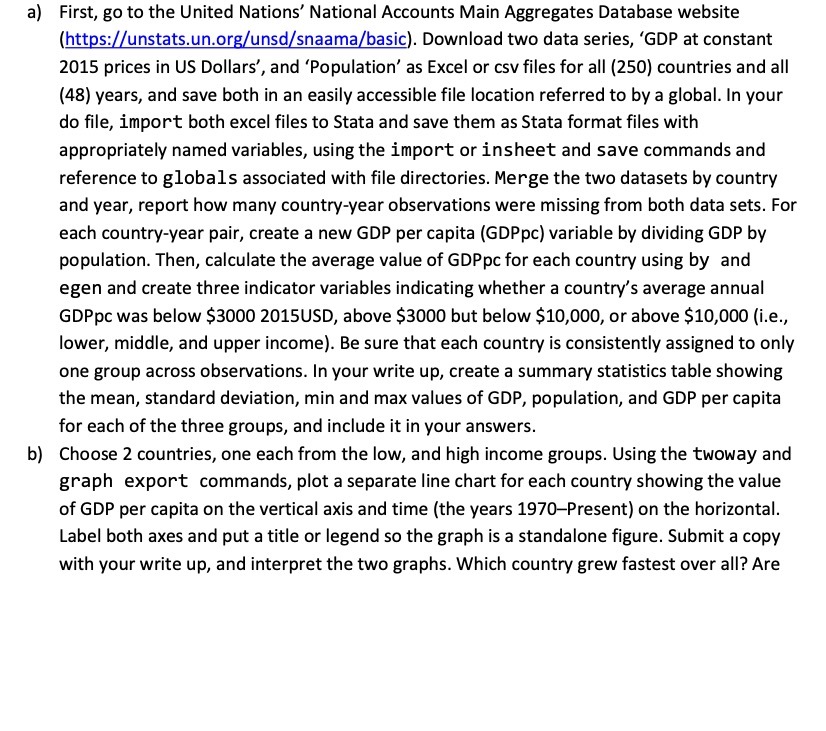
image text in transcribed
a} First, go to the United Nations" National Accounts Main Aggregates Database website {httpszunstats.un.org[unsdfsnaamagbasic]. Download two data series, 'GDP at constant 2015 prices in US Dollars', and 'Population' as Excel or csv files for all {250] countries and all {48) years, and save both in an easily accessible file location referred to by a global. In your do le, import both excel les to Stata and save them as Stata format files with appropriately named variables, using the import or insheet and save commands and reference to globals associated with file directories. Merge the two datasets by country and year, report how many country-year observations were missing from both data sets. For each country-year pair, create a new GDP per capita {GDPpc} variable by dividing GDP by population. Then, calculate the average value of GDPpc for each country using by and egen and create three indicator variables indicating whether a country's average annual GDPpc was below $3000 2015USD, above $3000 but below $10,000, or above $10,000 {i.e., lower, middle, and upper income}. Be sure that each country is consistently assigned to only one group across observations. In your write up, create a summary statistics table showing the mean, standard deviation, min and max values of GDP, population, and GDP per capita for each of the three groups, and include it in your answers. b} Choose 2 countries, one each from the low, and high income groups. Using the twoway and graph export commands, plot a separate line chart for each country showing the value of GDP per capita on the vertical axis and time {the years ISMPresent} on the horizontal. Label both axes and put a title or legend so the graph is a standalone gure. Submit a copy with your write up, and interpret the two graphs. Which country grew fastest over all? Are

Step by Step Solution

There are 3 Steps involved in it

Step: 1

blur-text-image

Get Instant Access to Expert-Tailored Solutions

See step-by-step solutions with expert insights and AI powered tools for academic success

Step: 2

blur-text-image

Step: 3

blur-text-image

Ace Your Homework with AI

Get the answers you need in no time with our AI-driven, step-by-step assistance

Get Started

Recommended Textbook for

Using Excel For Principles Of Econometrics

Authors: R Carter Hill, Genevieve Briand

4th Edition

1118032101, 9781118032107

More Books

Students also viewed these Economics questions