Answered step by step
Verified Expert Solution
Question
1 Approved Answer
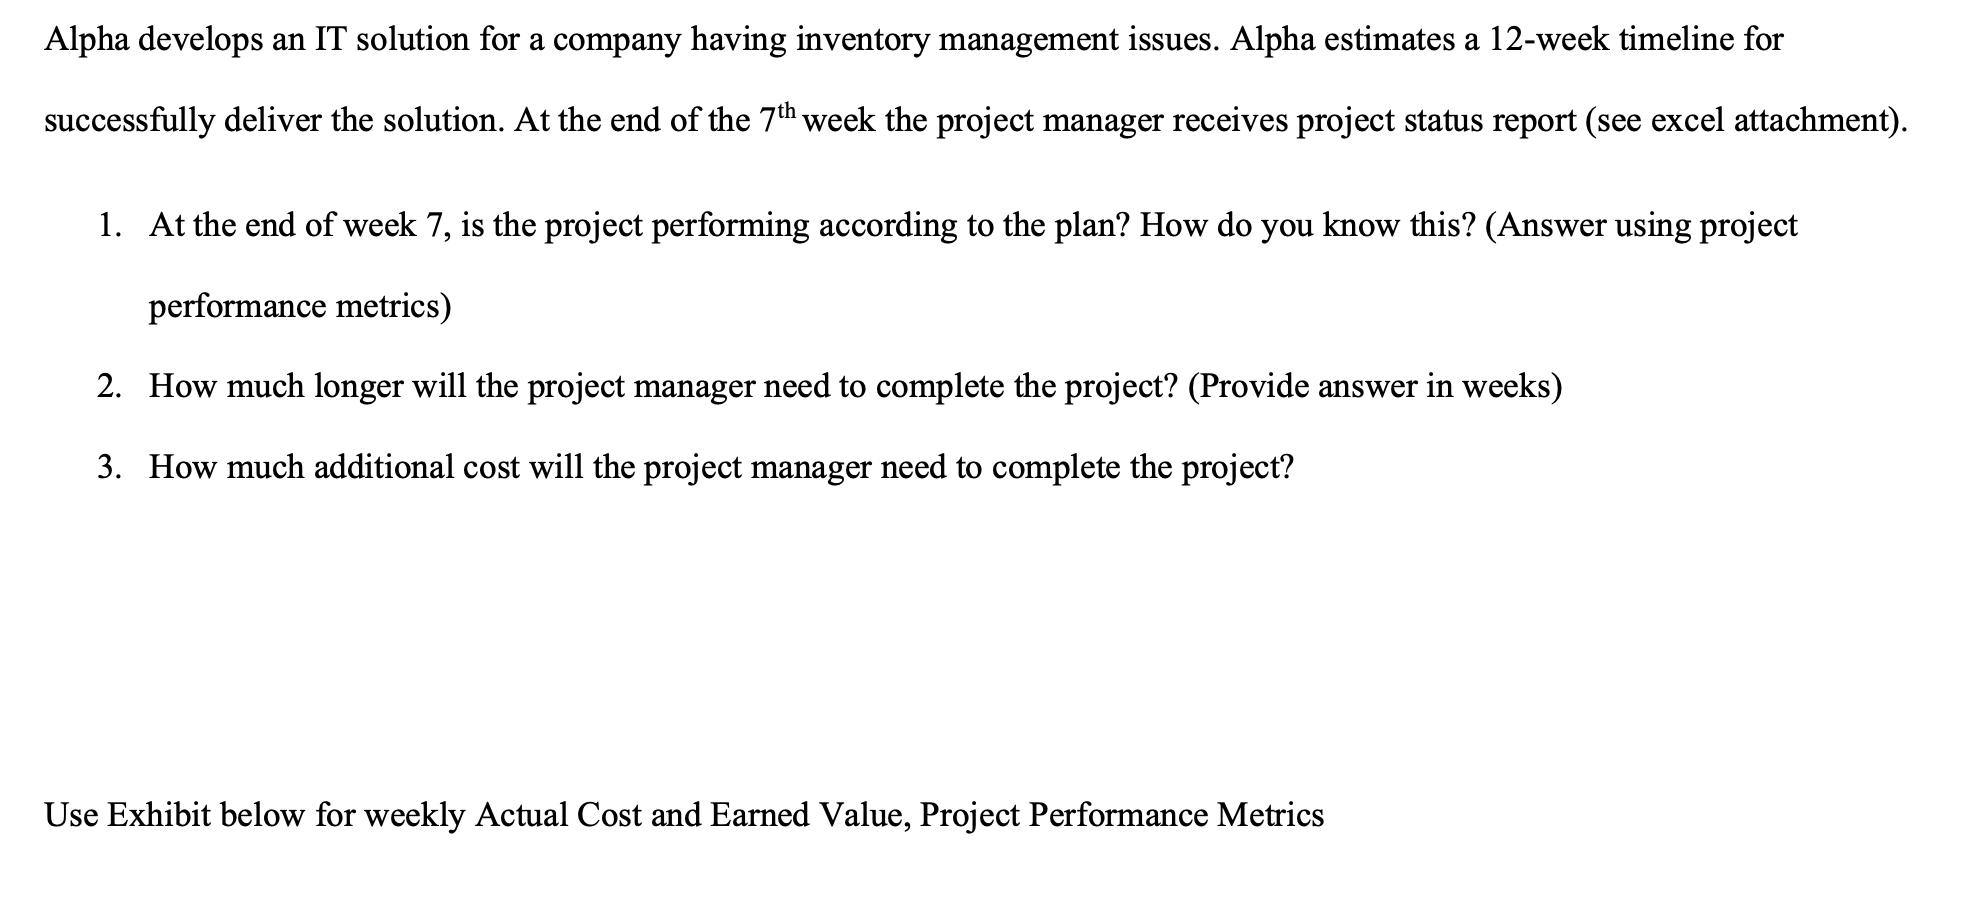
Alpha develops an IT solution for a company having inventory management issues. Alpha estimates a 12-week timeline for successfully deliver the solution. At the


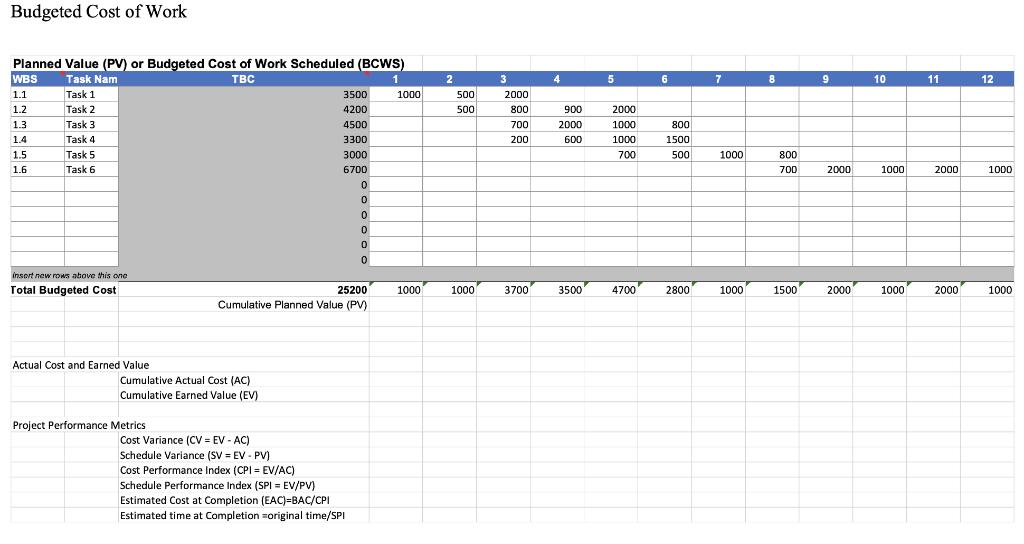
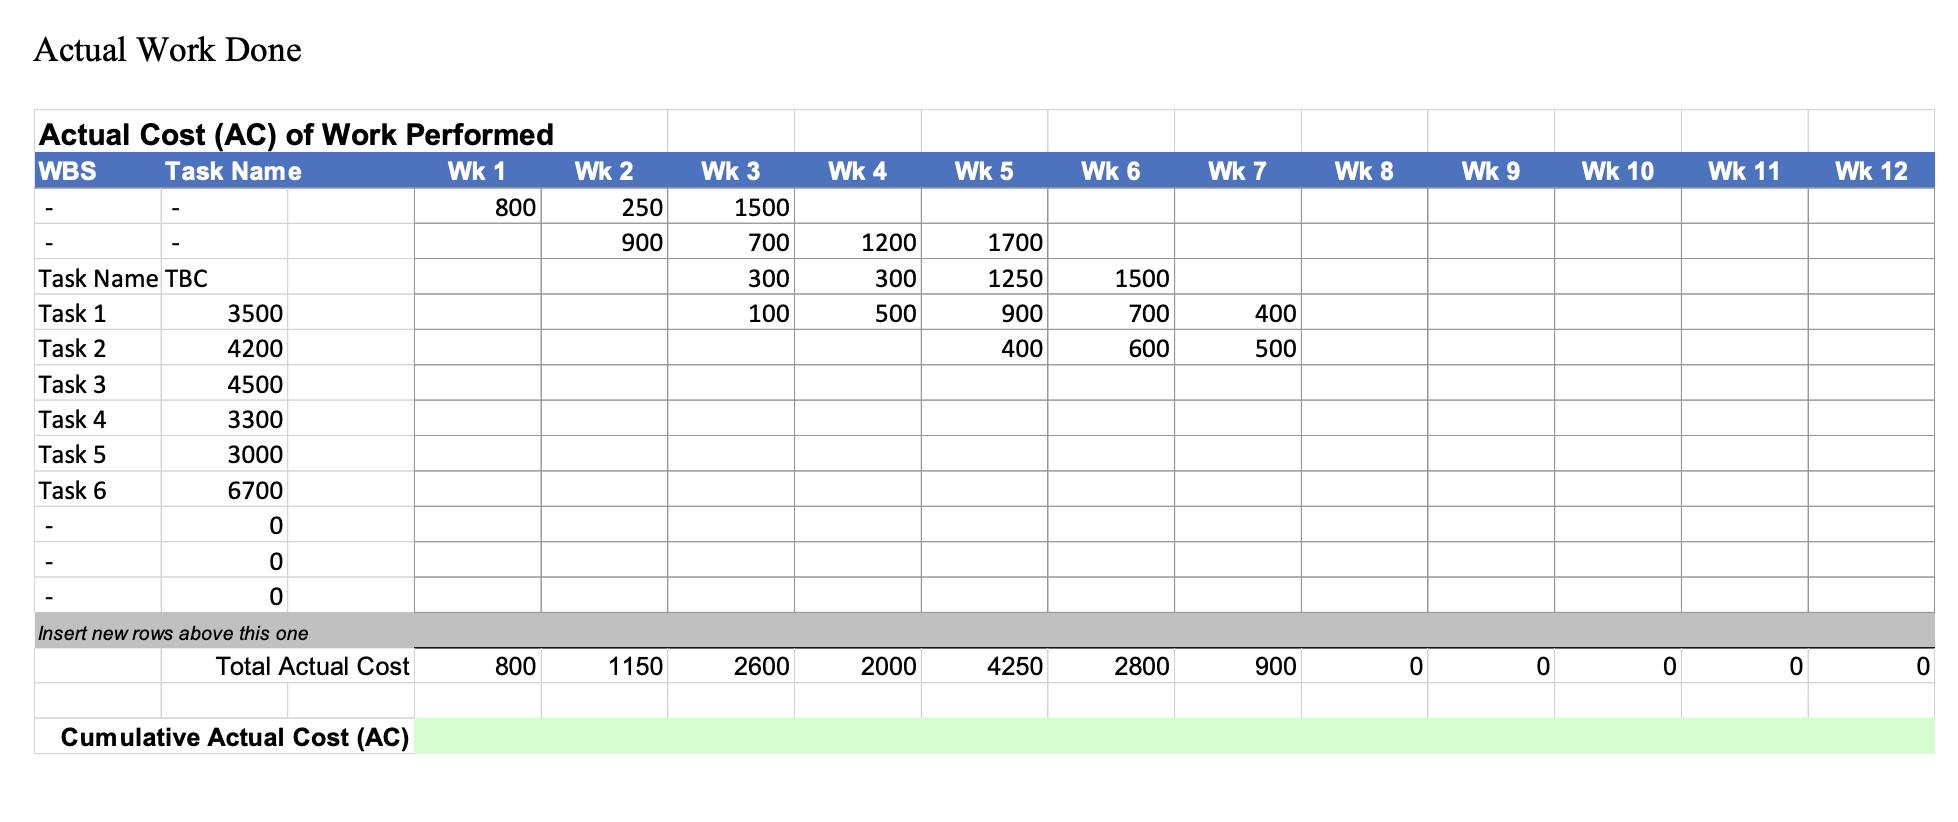
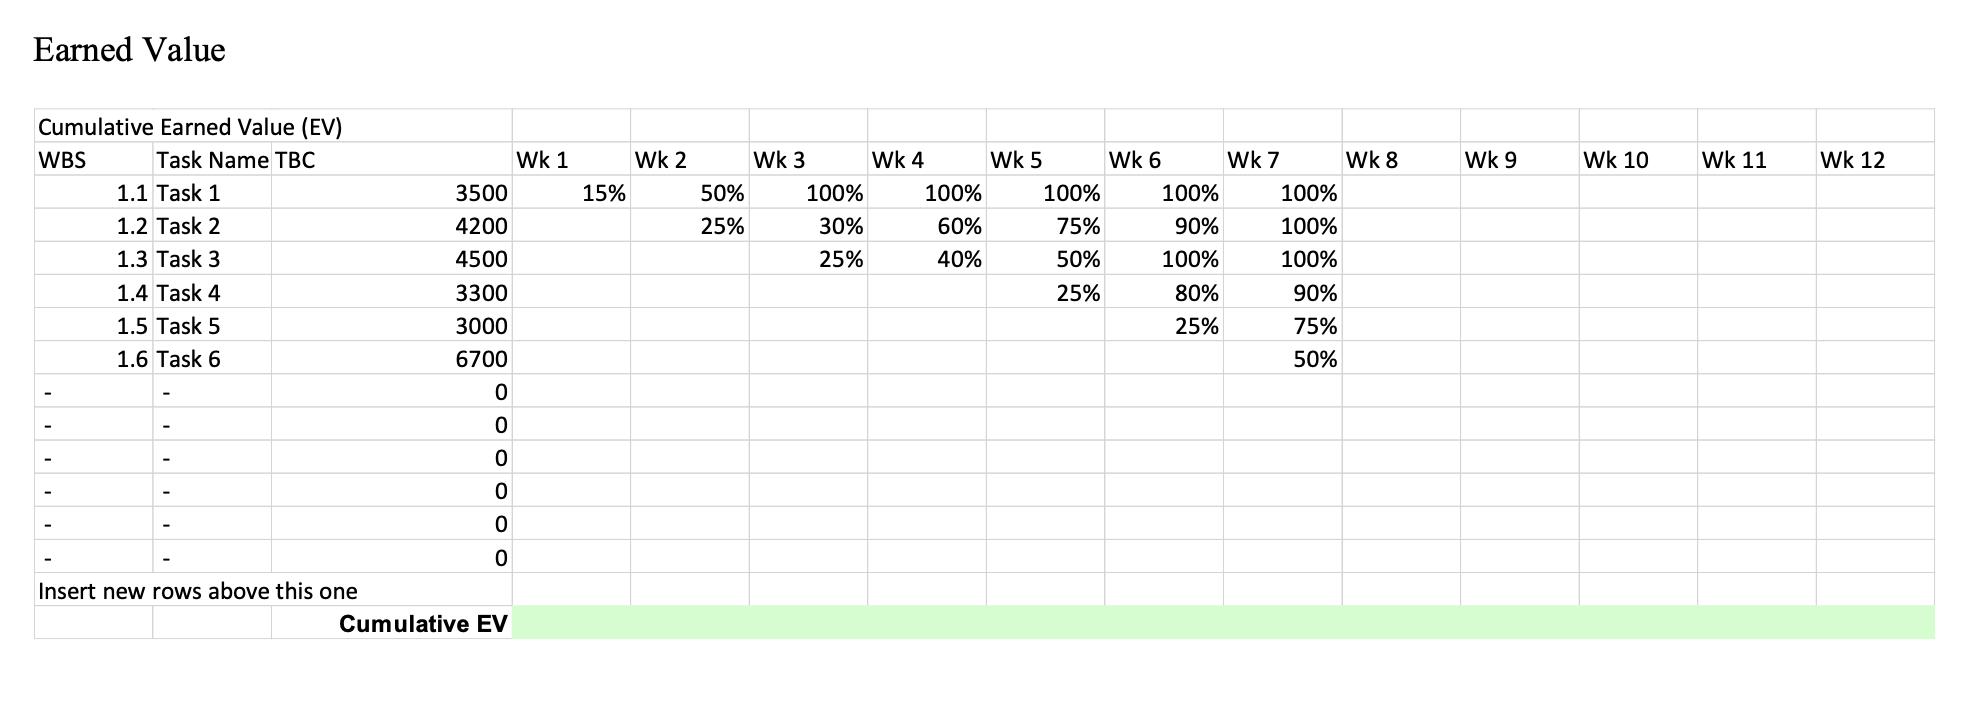
Alpha develops an IT solution for a company having inventory management issues. Alpha estimates a 12-week timeline for successfully deliver the solution. At the end of the 7th week the project manager receives project status report (see excel attachment). 1. At the end of week 7, is the project performing according to the plan? How do you know this? (Answer using project performance metrics) 2. How much longer will the project manager need to complete the project? (Provide answer in weeks) 3. How much additional cost will the project manager need to complete the project? Use Exhibit below for weekly Actual Cost and Earned Value, Project Performance Metrics Budgeted Cost of Work Planned Value (PV) or Budgeted Cost of Work Scheduled (BCWS) WBS Task Nam TBC 1 1.1 Task 1 1.2 Task 2 1.3 1.4 1.5 1.6 Task 3 Task 4 Task 5 Task 6 insert new rows above this one Total Budgeted Cost Actual Cost and Earned Value Cumulative Actual Cost (AC) Cumulative Earned Value (EV) Project Performance Metrics 3500 4200 4500 3300 3000 6700 0 Cost Variance (CV EV- AC) Schedule Variance (SV EV- PV) Cost Performance Index (CPI = EV/AC) Schedule Performance Index (SPI = EV/PV) Estimated Cost at Completion (EAC)=BAC/CPI Estimated time at Completion original time/SPI 0 0 25200 Cumulative Planned Value (PV) 0 0 0 1000 1000 2 500 500 1000 3 2000 800 700 200 3700 4 900 2000 600 3500 5 2000 1000 1000 700 4700 6 800 1500 500 2800 7 1000 1000 8 800 700 1500 9 2000 2000 10 1000 1000 11 2000 2000 12 1000 1000 Actual Work Done Actual Cost (AC) of Work Performed WBS Task Name Wk 1 Task Name TBC Task 1 Task 2 Task 3 Task 4 Task 5 Task 6 3500 4200 4500 3300 3000 6700 0 0 0 Insert new rows above this one Total Actual Cost Cumulative Actual Cost (AC) 800 800 Wk 2 250 900 1150 WK 3 1500 700 300 100 2600 WK 4 1200 300 500 2000 WK 5 1700 1250 900 400 4250 Wk 6 1500 700 600 2800 Wk 7 400 500 900 WK 8 0 WK 9 0 WK 10 0 Wk 11 0 Wk 12 0 Earned Value Cumulative Earned Value (EV) WBS Task Name TBC - 1.1 Task 1 1.2 Task 2 1.3 Task 3 1.4 Task 4 1.5 Task 5 1.6 Task 6 - - - Insert new rows above this one 3500 4200 4500 3300 3000 6700 0 0 OOO OO 0 0 Cumulative EV Wk 1 15% Wk 2 50% 25% WK 3 100% 30% 25% Wk 4 100% 60% 40% WK 5 100% 75% 50% 25% Wk 6 100% 90% 100% 80% 25% Wk 7 100% 100% 100% 90% 75% 50% Wk 8 Wk 9 Wk 10 Wk 11 Wk 12
Step by Step Solution
★★★★★
3.43 Rating (153 Votes )
There are 3 Steps involved in it
Step: 1
ANSWER 1 At the end of week 7 the project is not performing according to th...
Get Instant Access to Expert-Tailored Solutions
See step-by-step solutions with expert insights and AI powered tools for academic success
Step: 2

Step: 3

Ace Your Homework with AI
Get the answers you need in no time with our AI-driven, step-by-step assistance
Get Started


