

Answered step by step
Verified Expert Solution
Question
1 Approved Answer
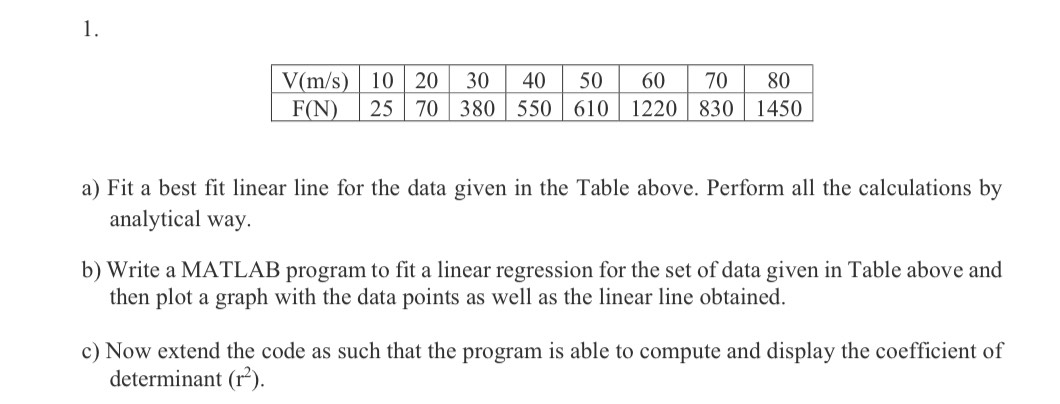
a ) Fit a best fit linear line for the data given in the Table above. Perform all the calculations by analytical way. b )
a Fit a best fit linear line for the data given in the Table above. Perform all the calculations by
analytical way.
b Write a MATLAB program to fit a linear regression for the set of data given in Table above and
then plot a graph with the data points as well as the linear line obtained.
c Now extend the code as such that the program is able to compute and display the coefficient of
determinant
Step by Step Solution
There are 3 Steps involved in it
Step: 1

Get Instant Access to Expert-Tailored Solutions
See step-by-step solutions with expert insights and AI powered tools for academic success
Step: 2

Step: 3
Ace Your Homework with AI
Get the answers you need in no time with our AI-driven, step-by-step assistance
Get Started
Records And Database Management
Authors: Jeffrey R Stewart Ed D, Judith S Greene, Judith A Hickey
4th Edition
0070614741, 9780070614741