A
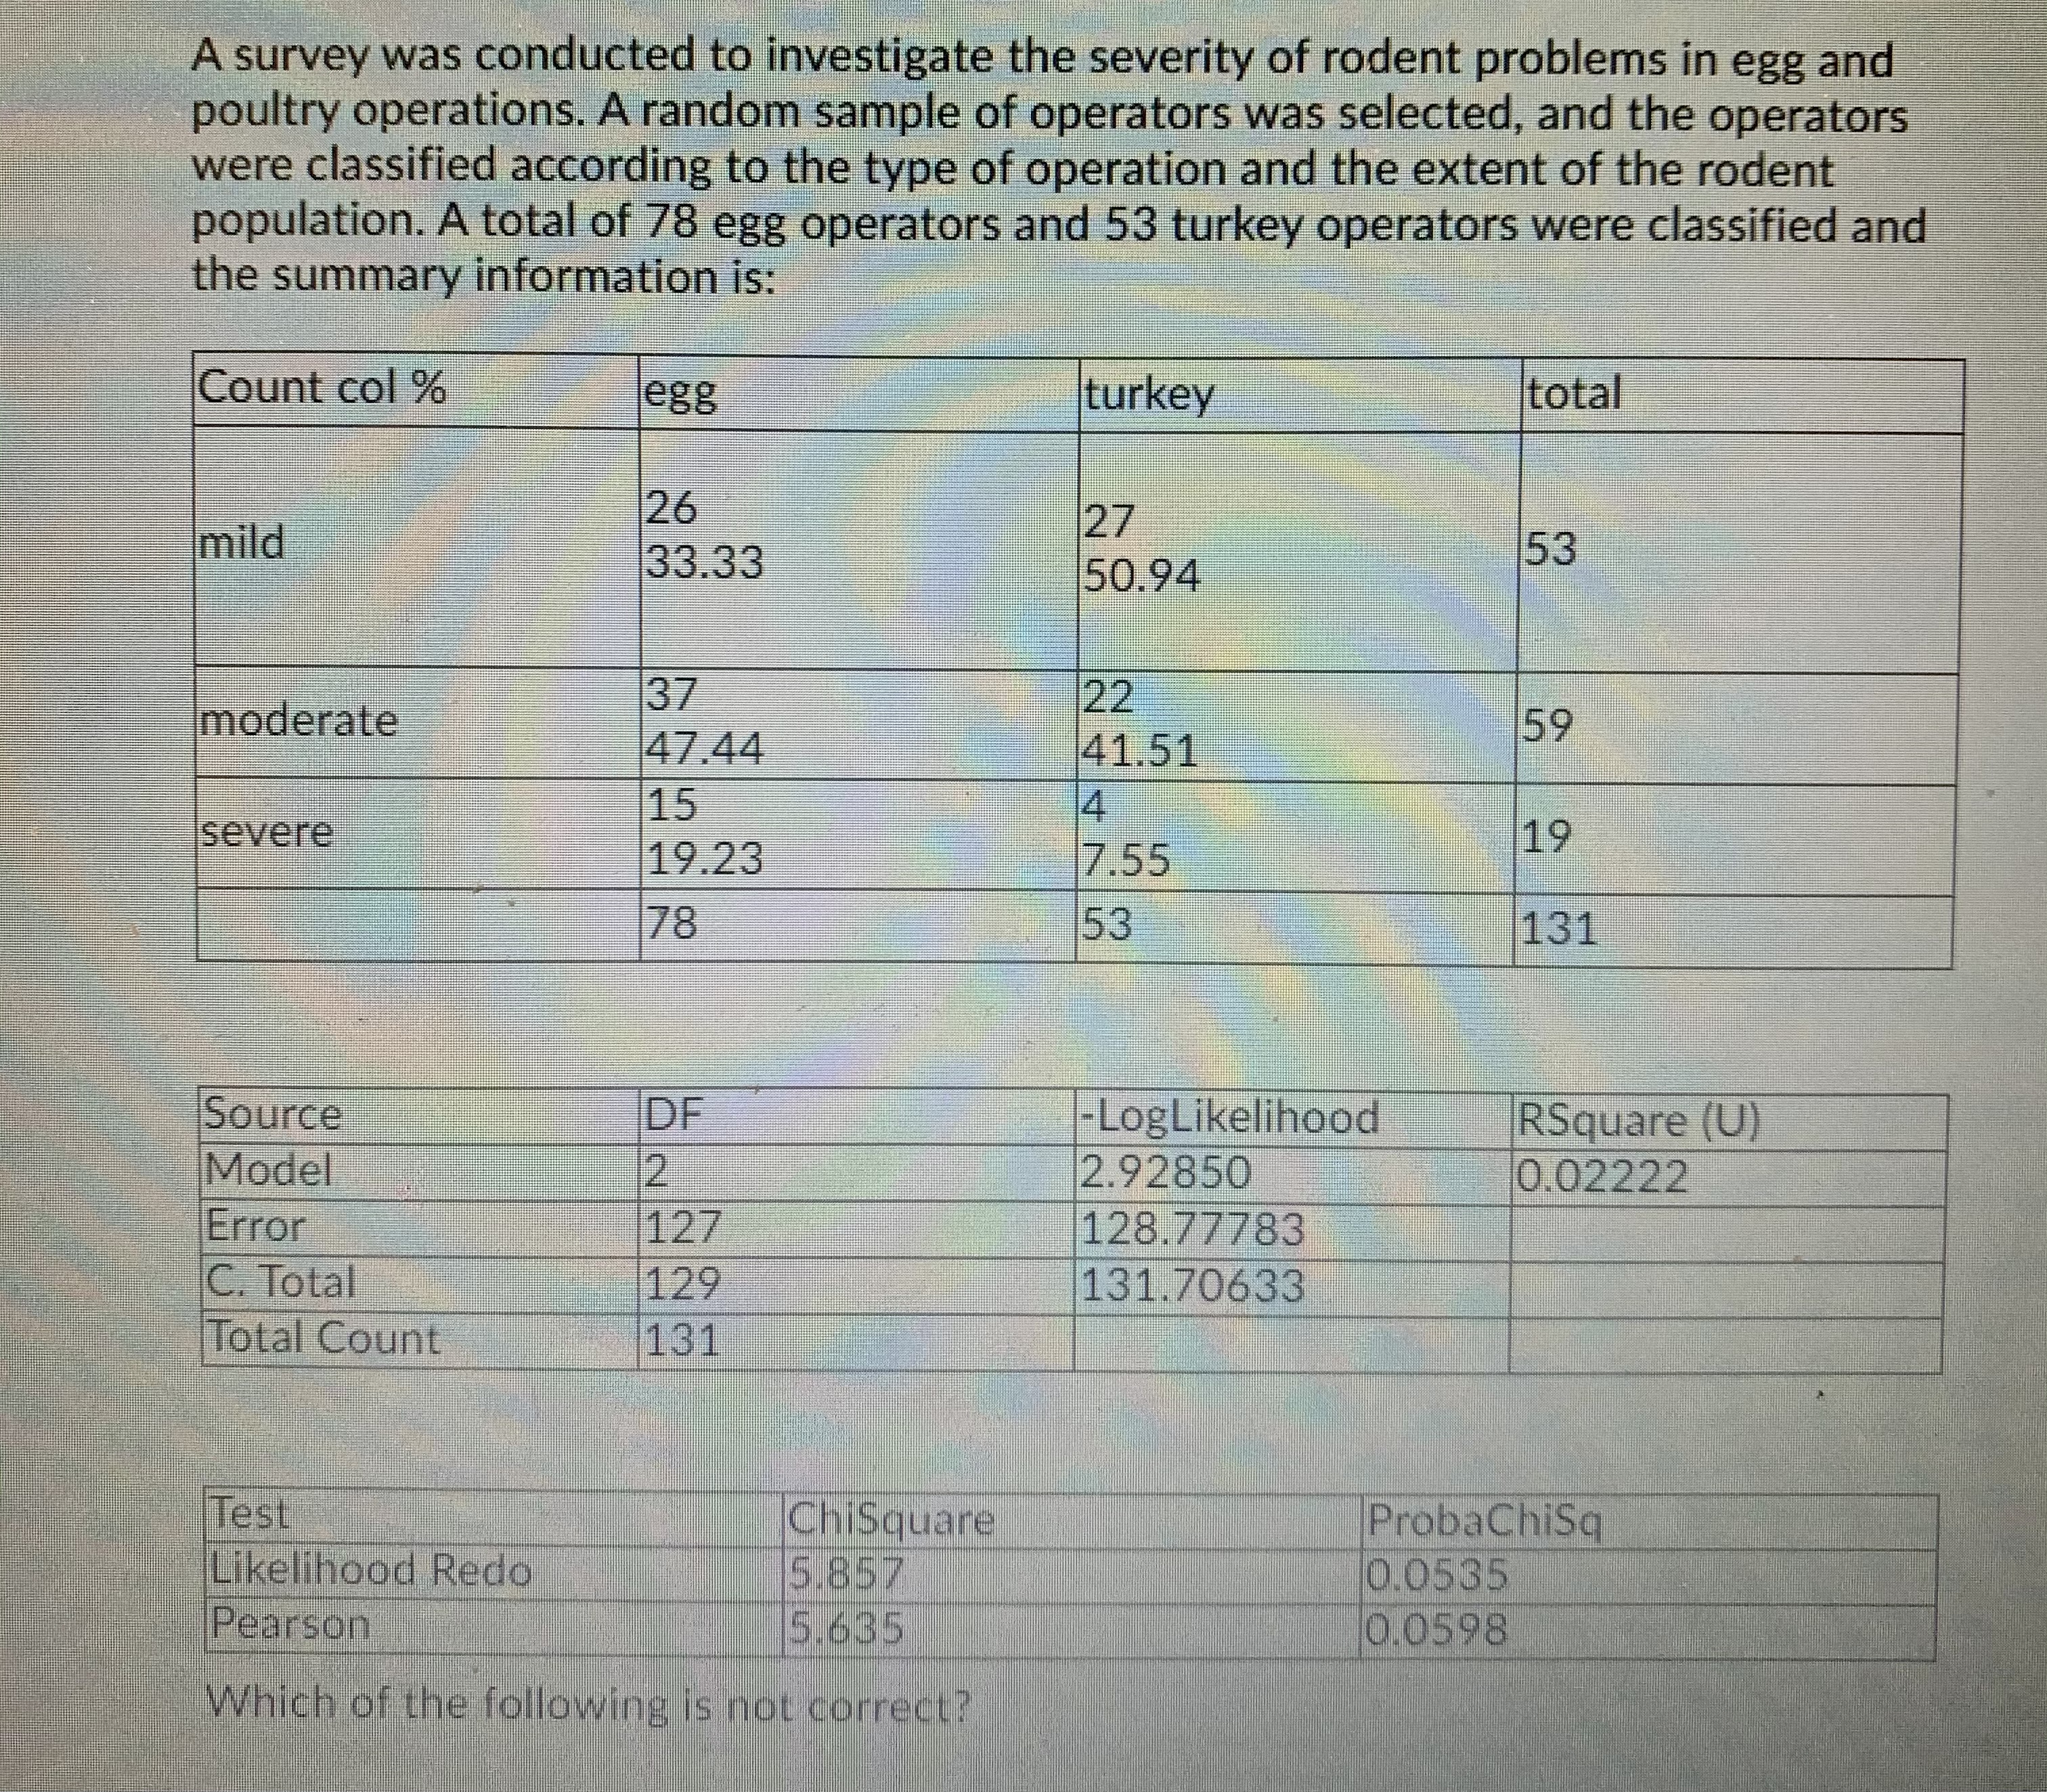
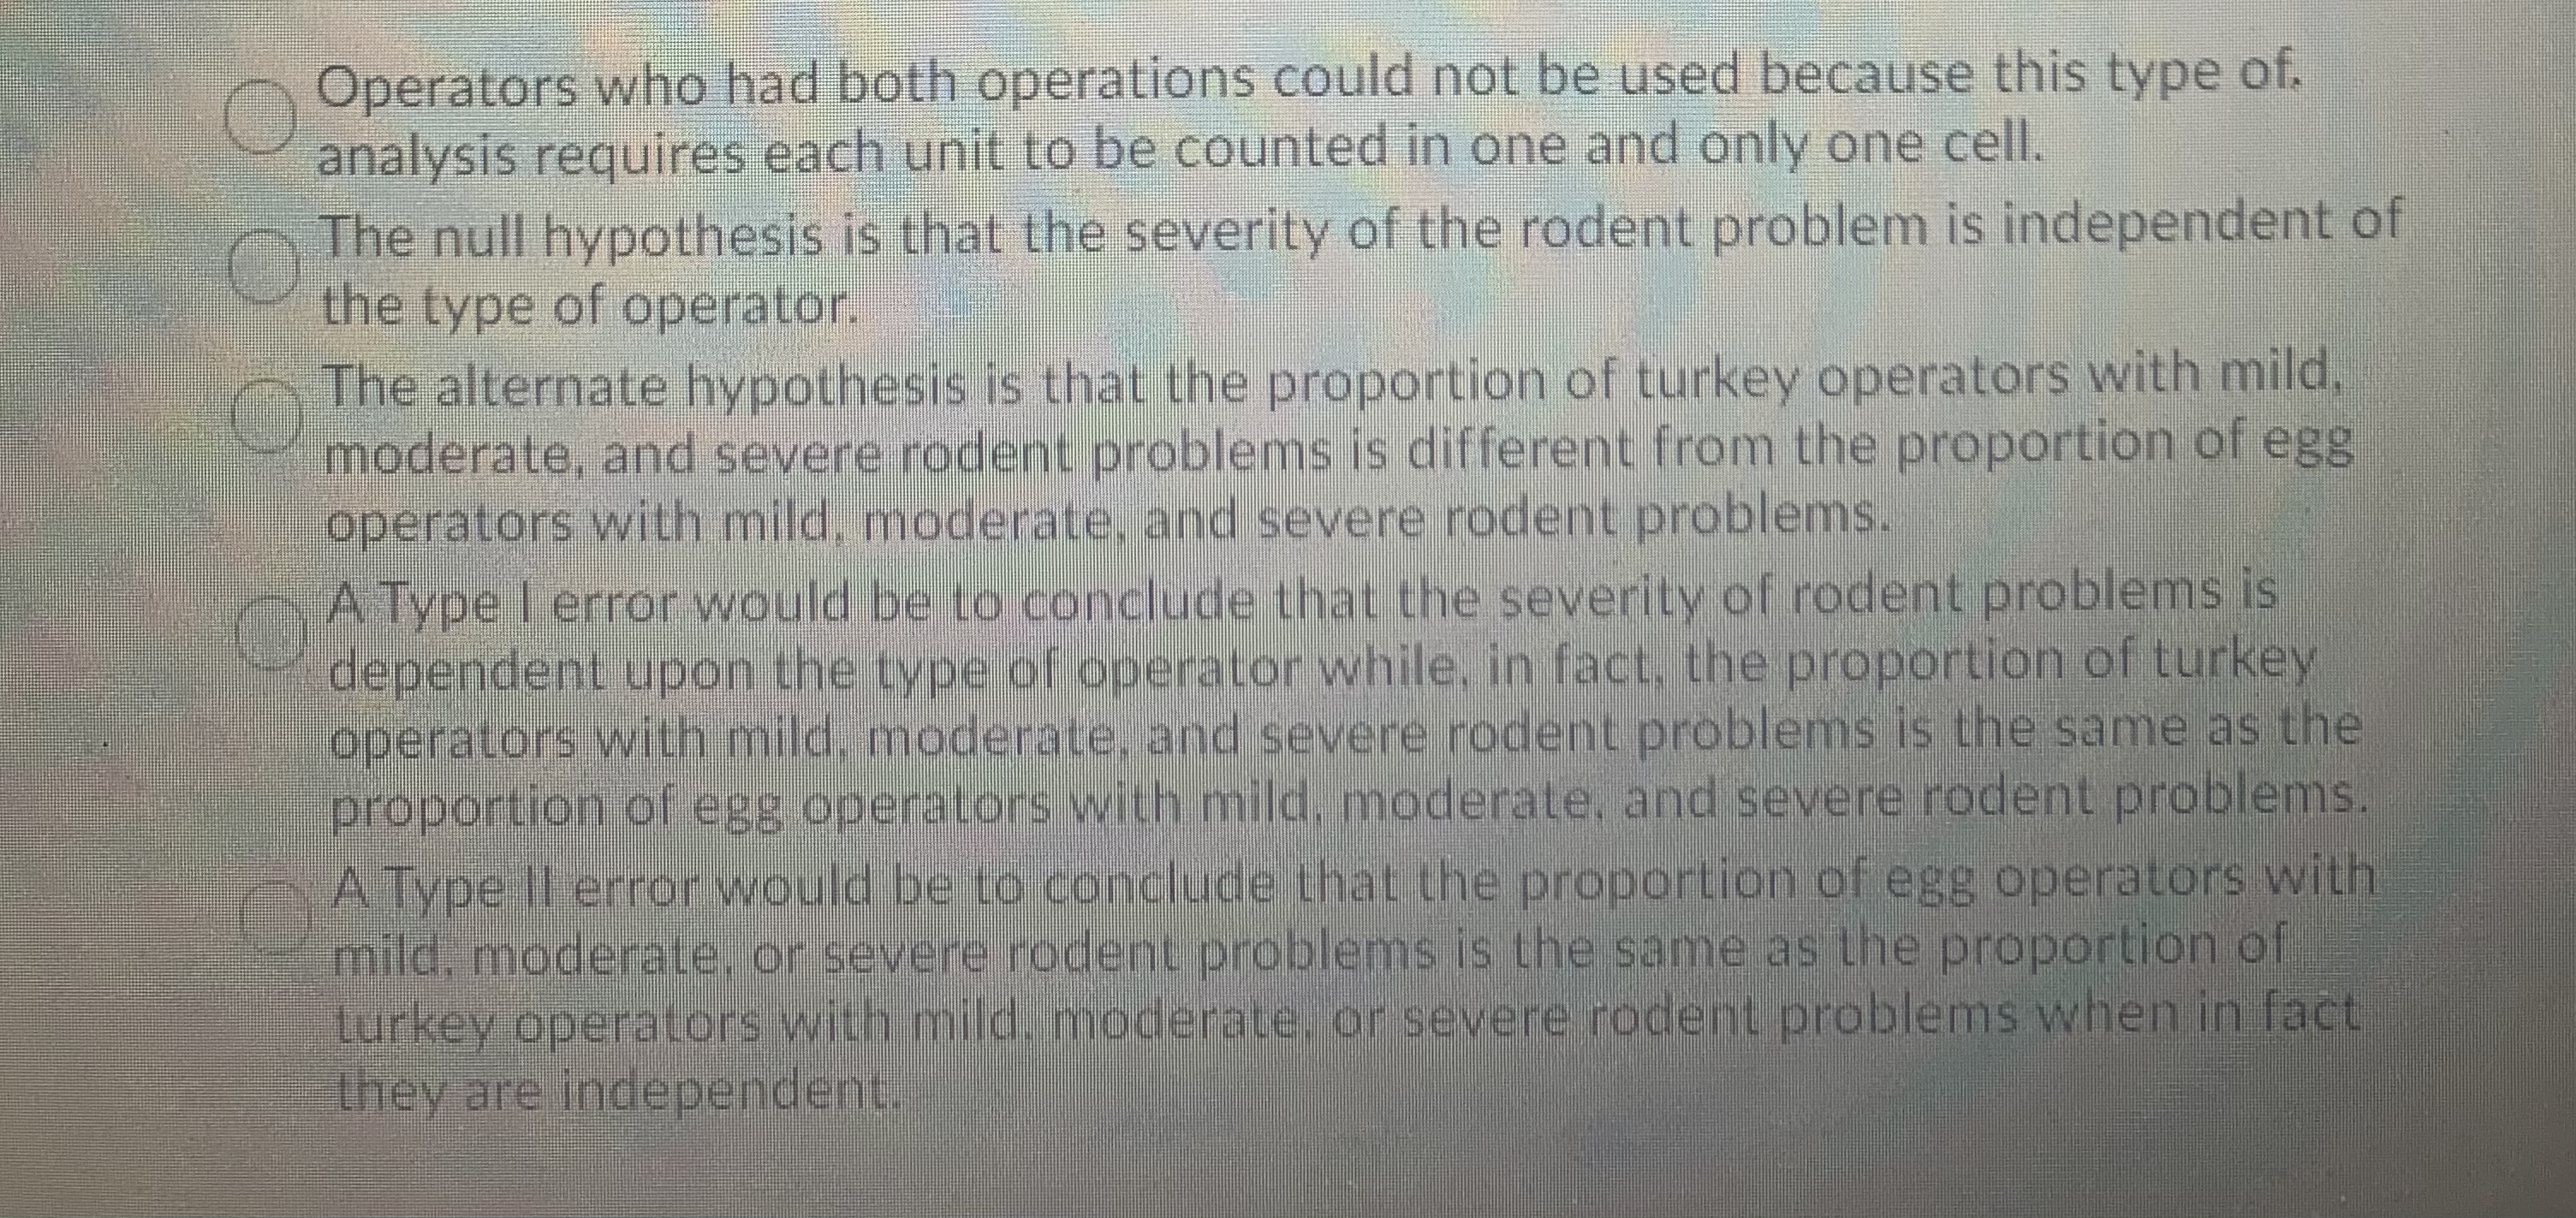
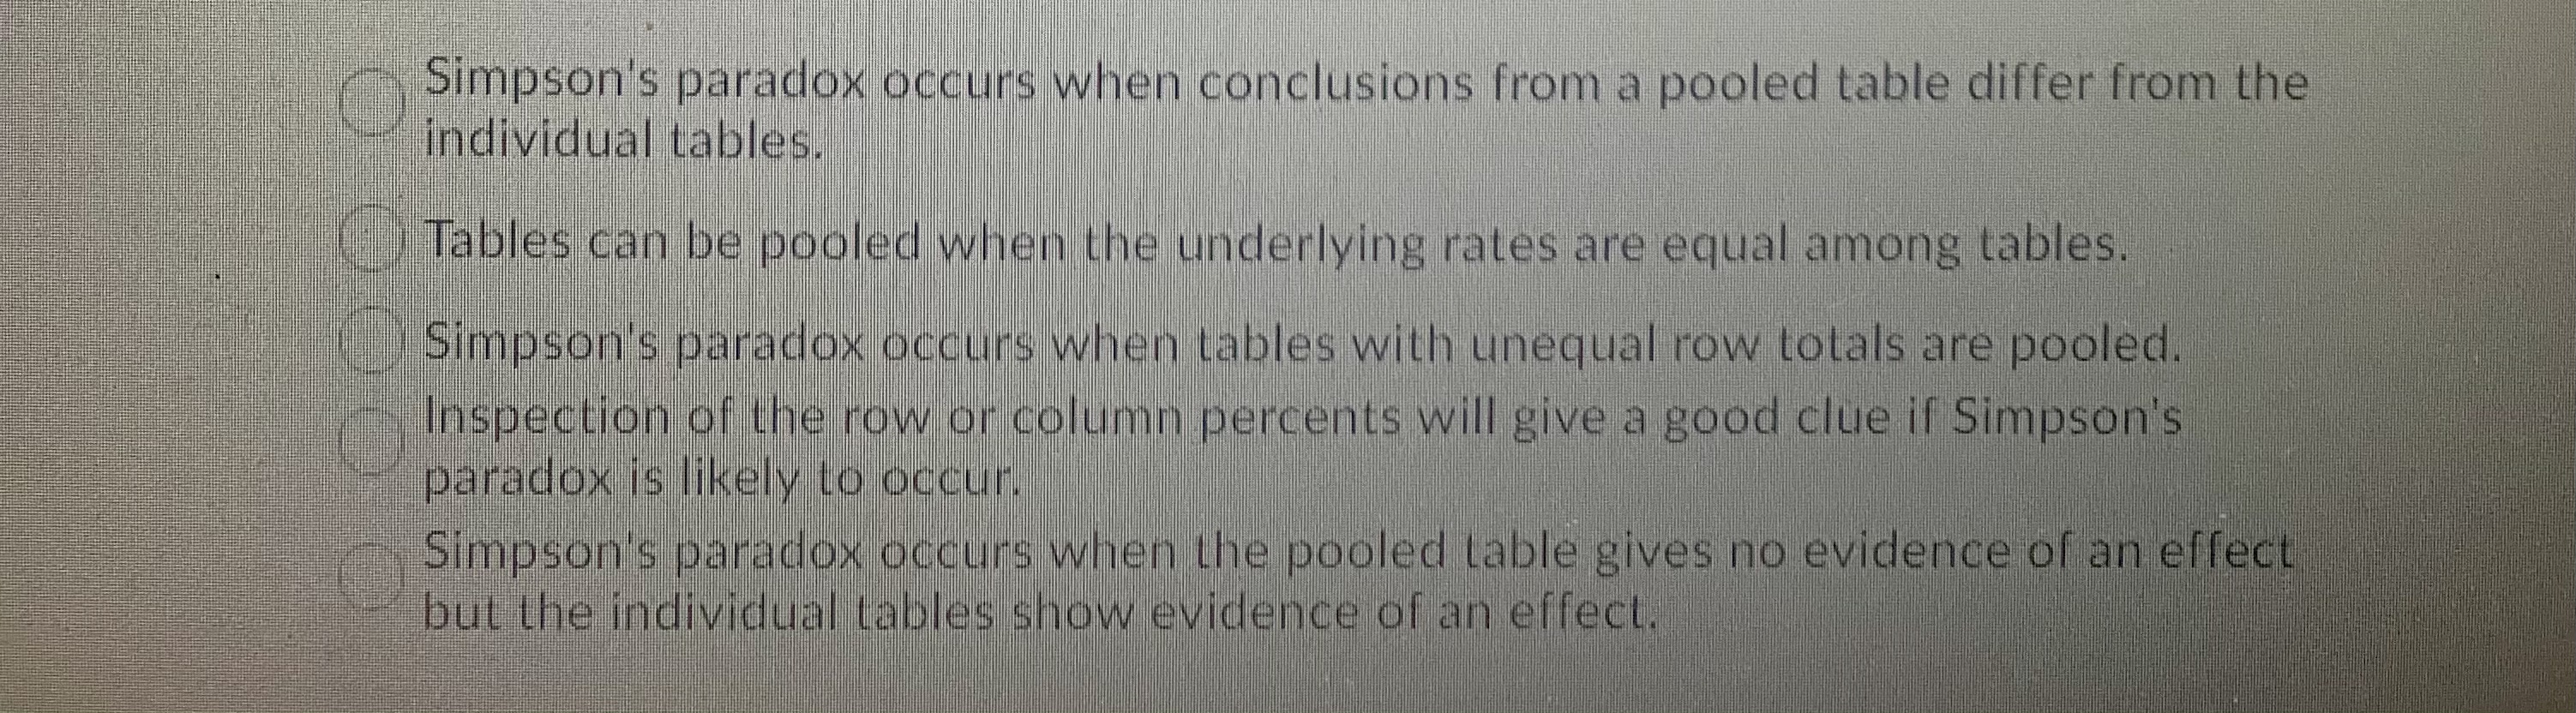
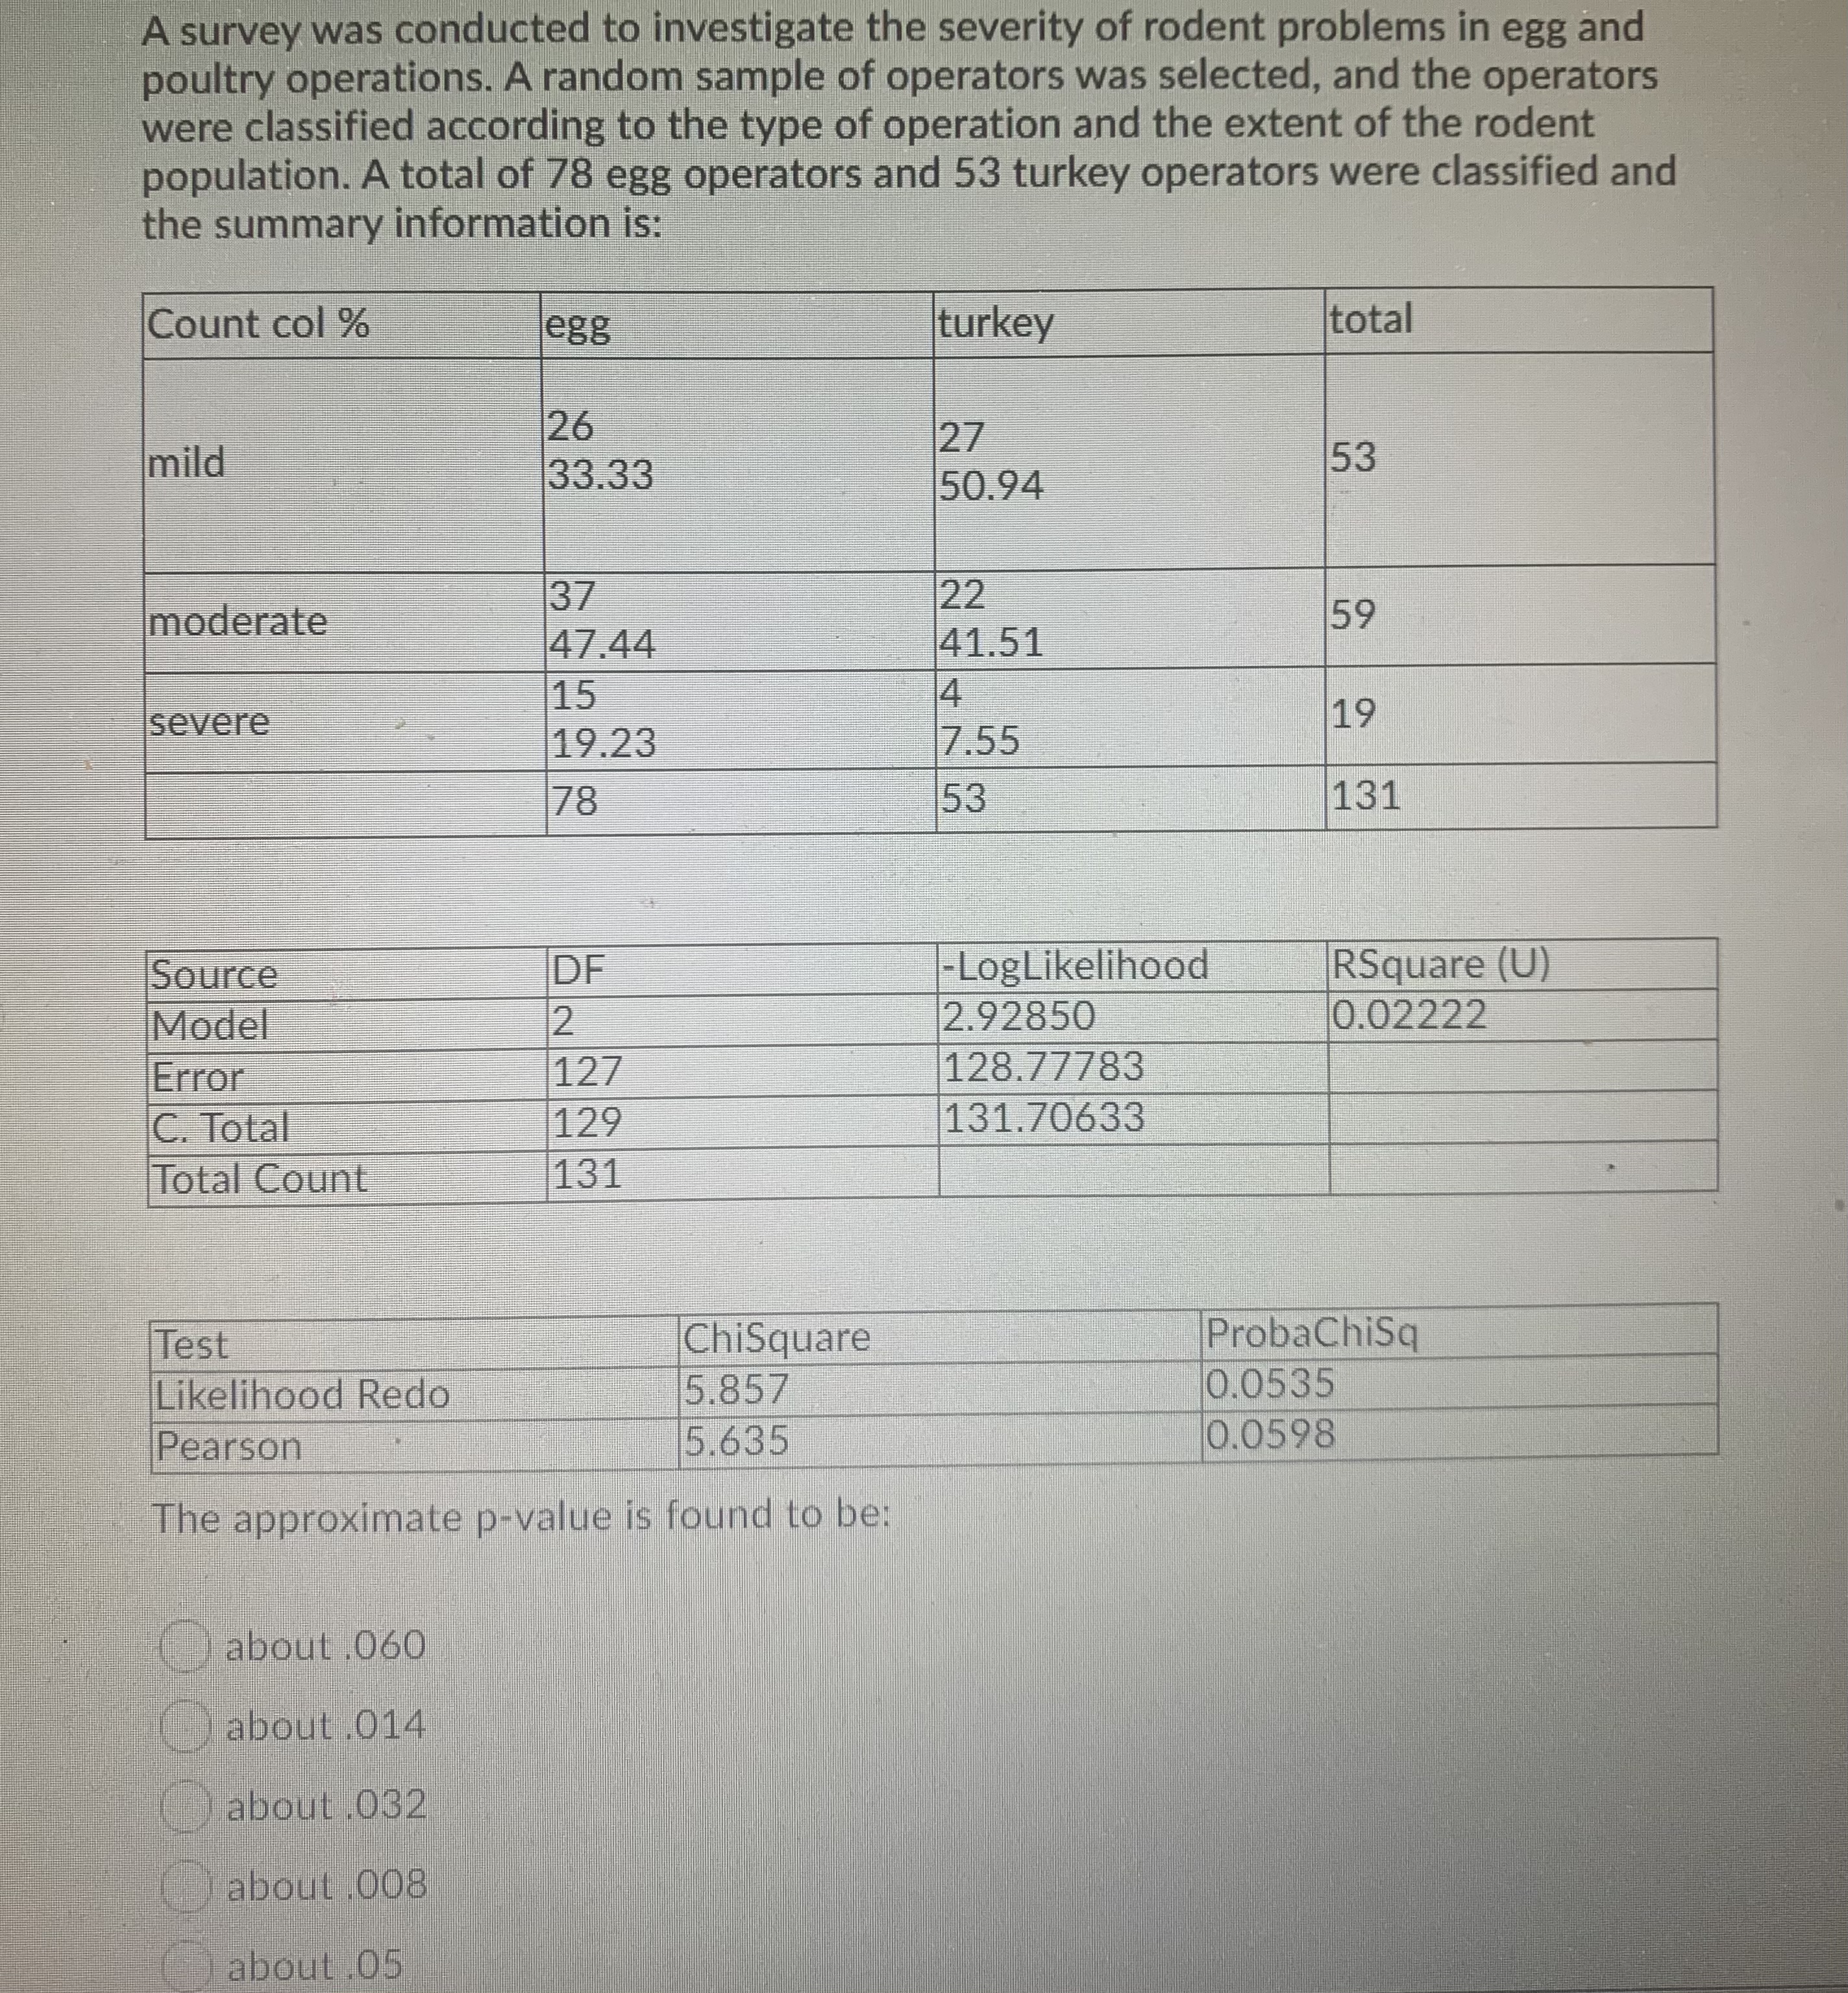
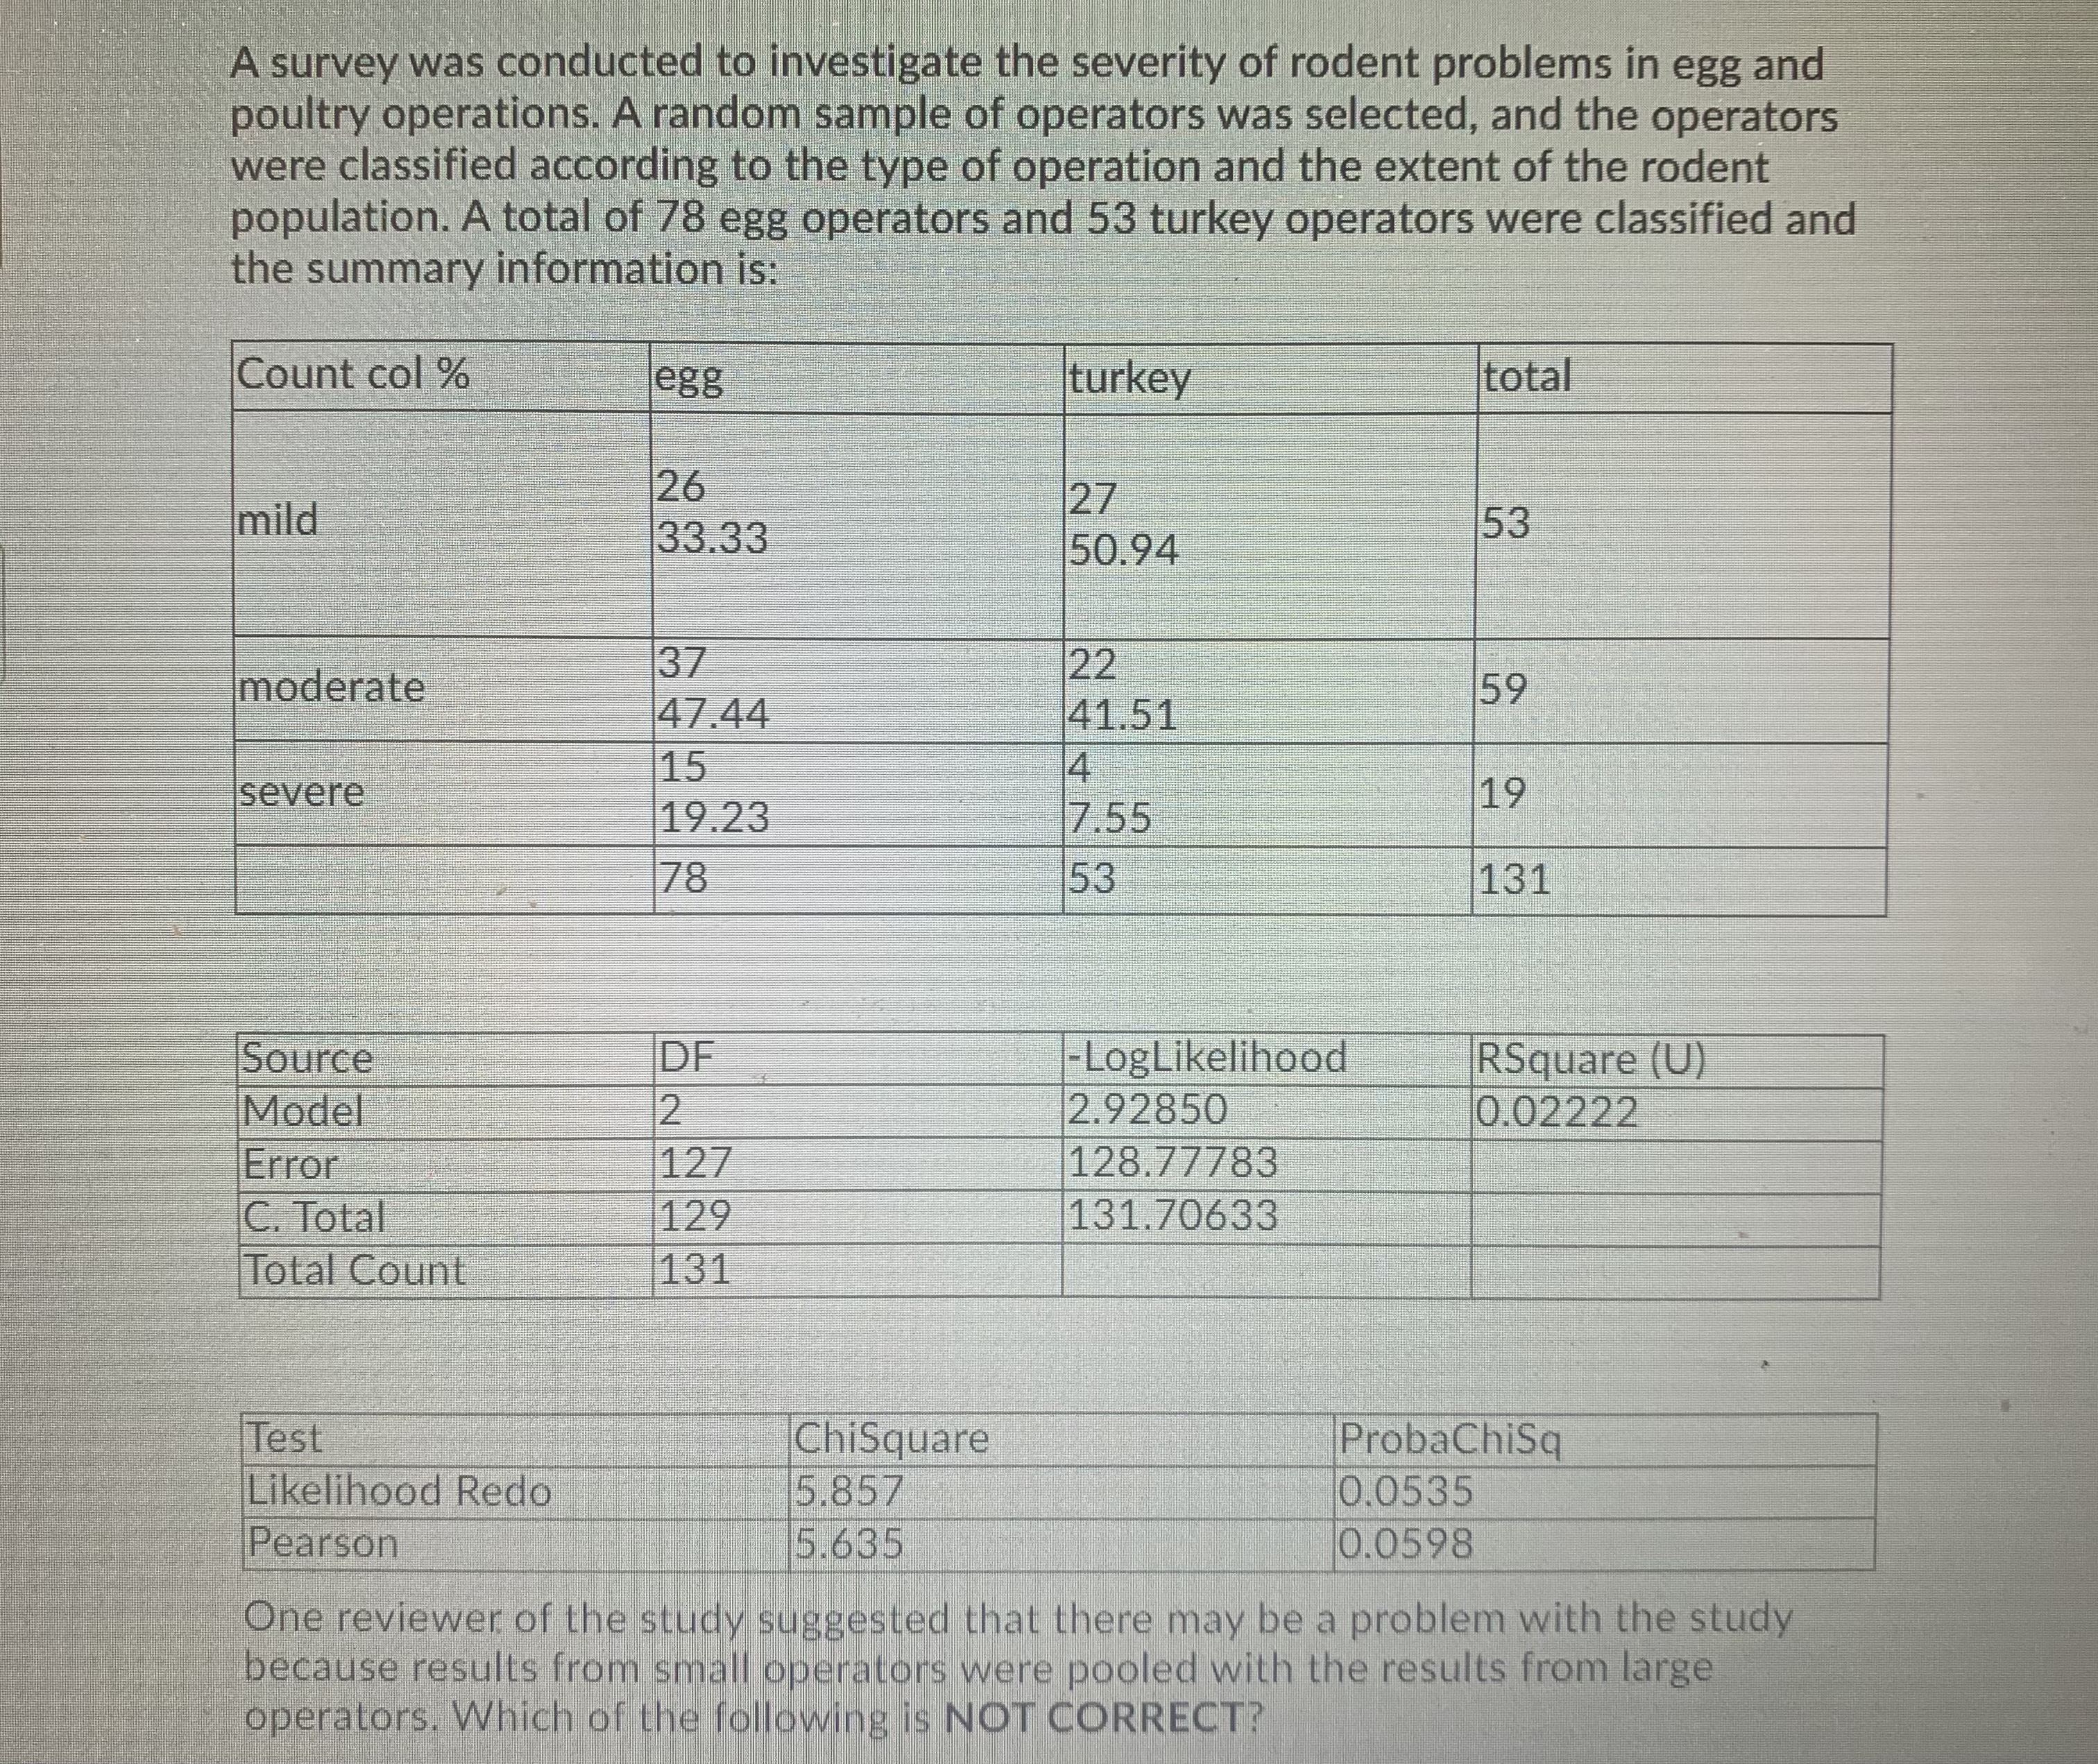
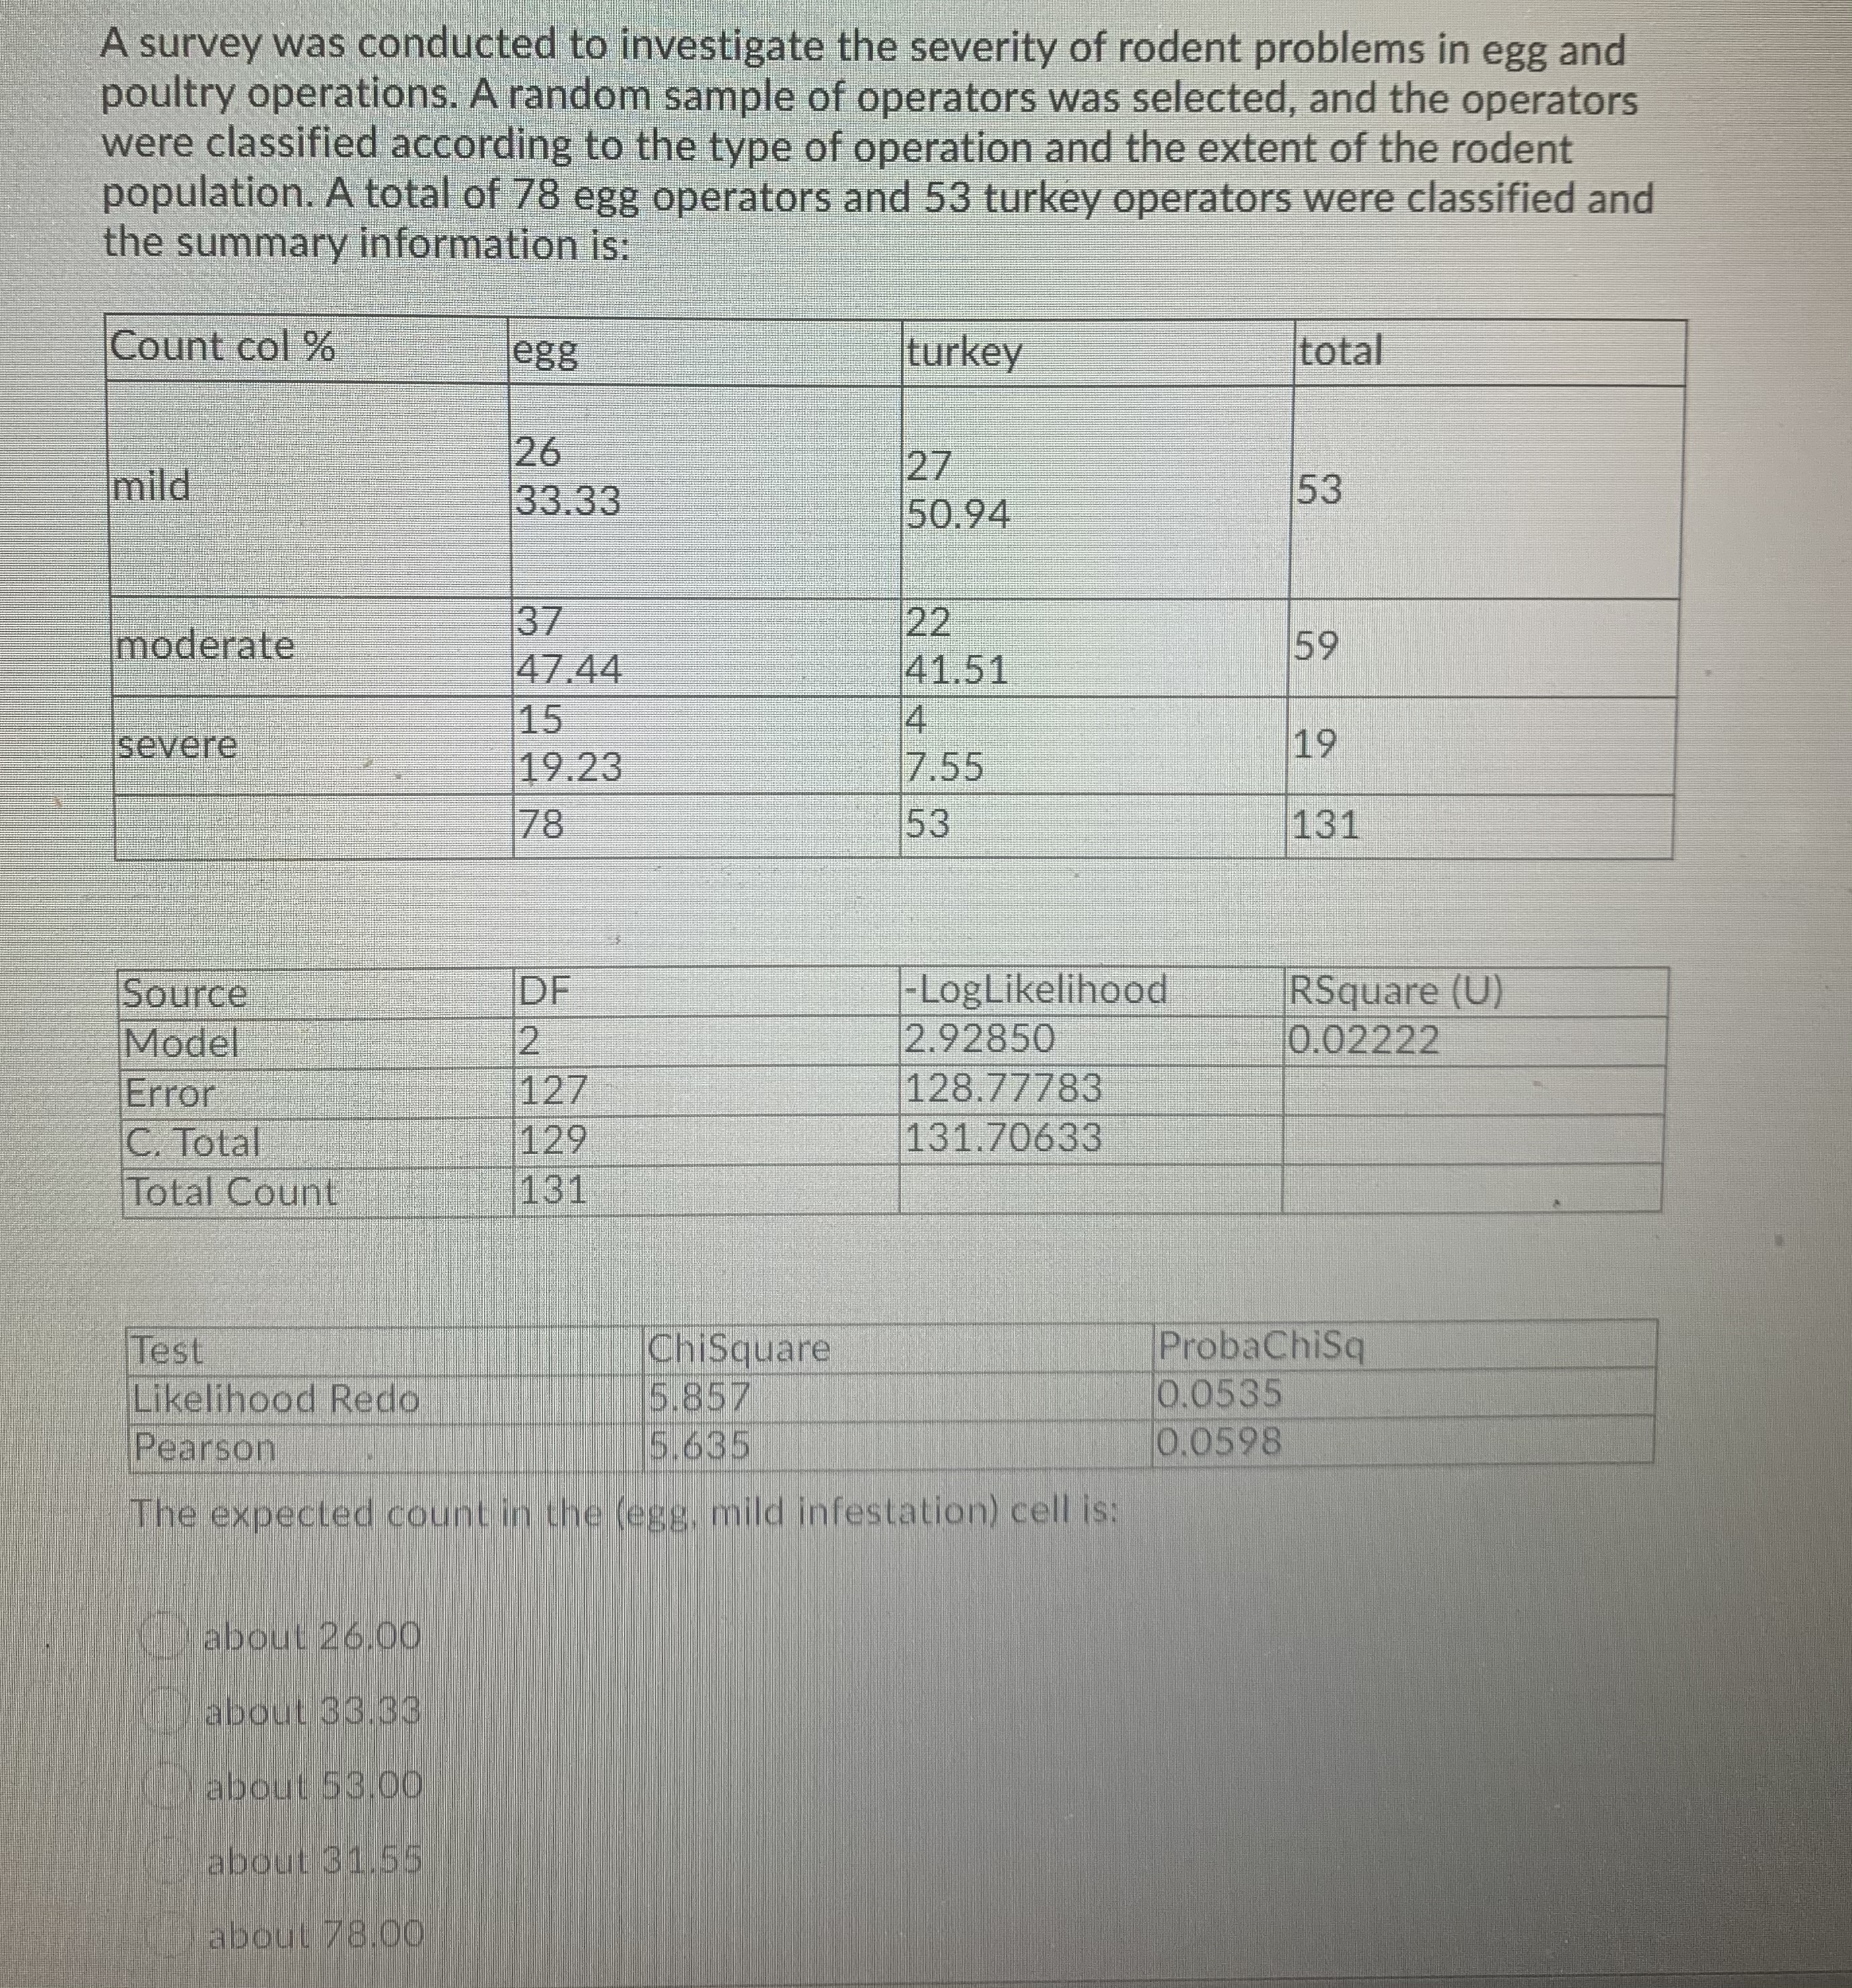
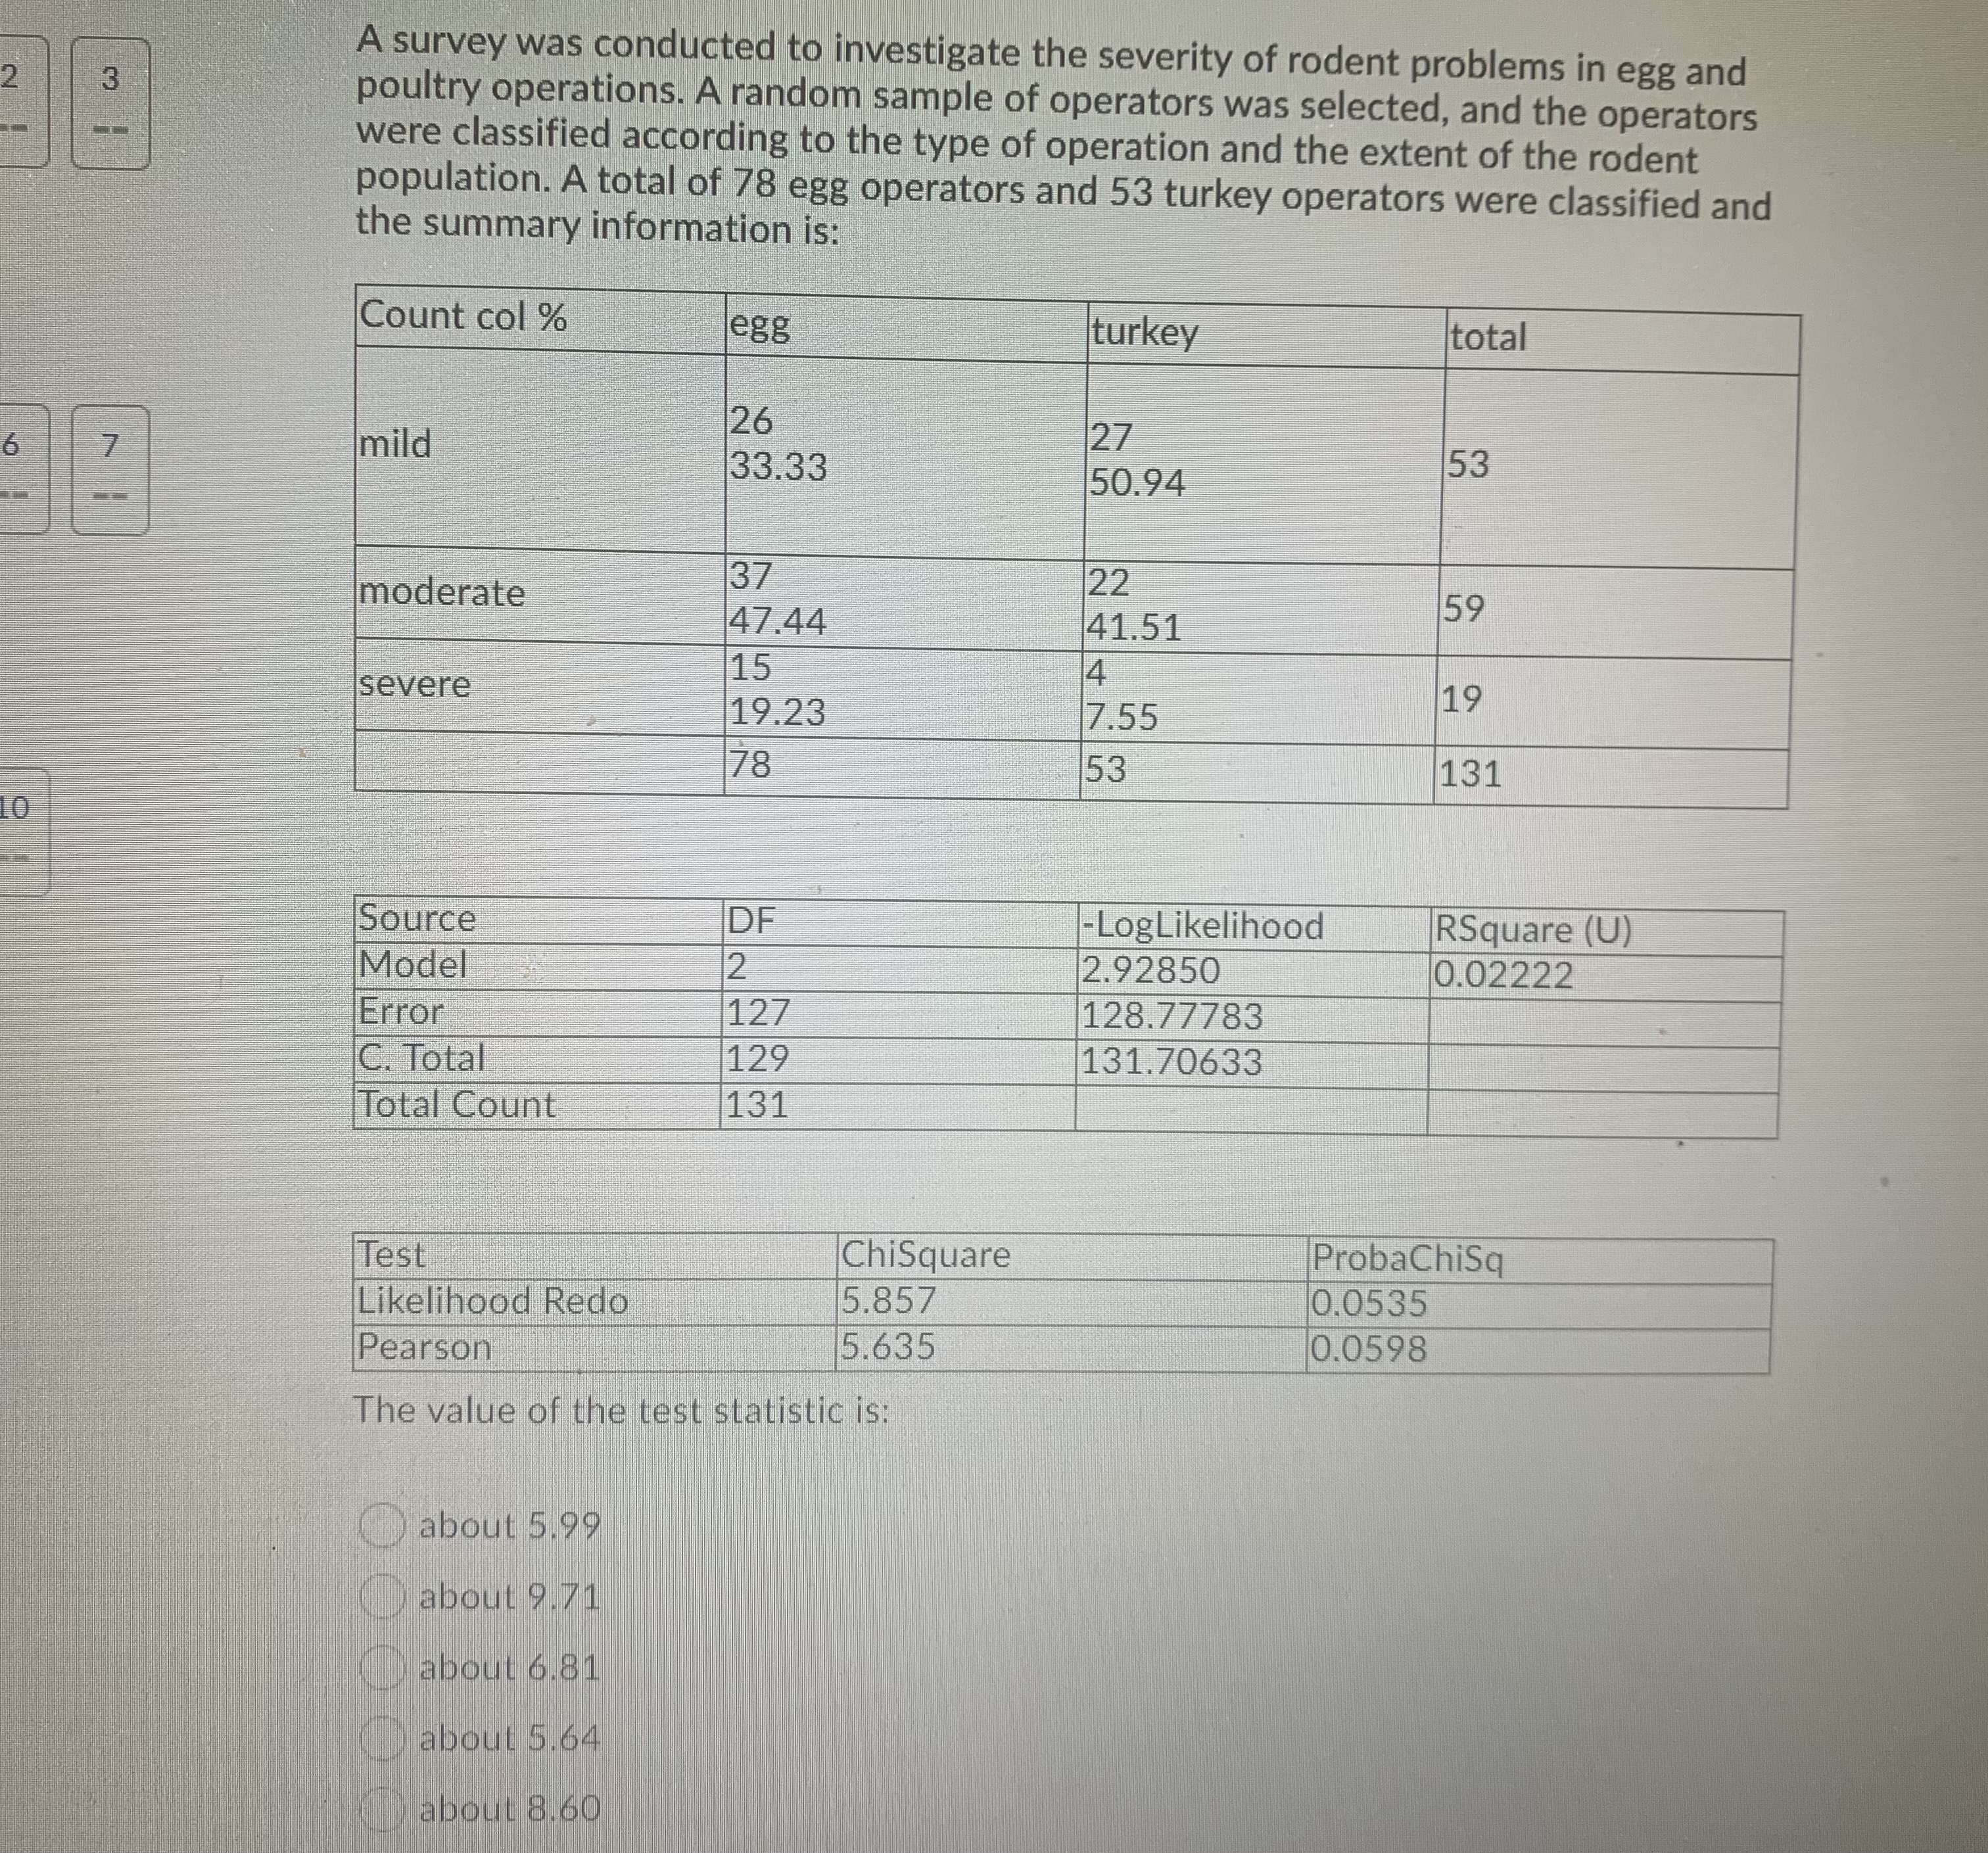
\fOperators who had both operations could not be used because this type of. analysis requires each unit to be counted in one and only one cell. The null hypothesis is that the severity of the rodent problem is independent of the type of operator. The alternate hypothesis is that the proportion of turkey operators with mild. moderate, and severe rodent problems is different from the proportion of egg operators with mild, moderate, and severe rodent problems. A Type | error would be to conclude that the severity of rodent problems is dependent upon the type of operator while, in fact, the proportion of turkey operators with mild. moderate, and severe rodent problems is the same as the proportion of egs operators with mild, moderate, and severe rodent problems. A Type II error would be to conclude that the proportion of egg operators with mild, moderate, or severe rodent problems is the same as the proportion of turkey operators with mild. moderate, or severe rodent problems when in fact they are independentSimpson's paradox occurs when conclusions from a pooled table differ from the individual tables. Tables can be pooled when the underlying rates are equal among tables. Simpson's paradox occurs when tables with unequal row totals are pooled. Inspection of the row or column percents will give a good clue if Simpson's paradox is likely to occur Simpson's paradox occurs when the pooled table gives no evidence of an effect but the individual tables show evidence of an effect.A survey was conducted to investigate the severity of rodent problems in egg and poultry operations. A random sample of operators was selected, and the operators were classified according to the type of operation and the extent of the rodent population. A total of 78 egg operators and 53 turkey operators were classified and the summary information is: Count col % egg turkey total 26 mild 27 33.33 50.94 53 37 moderate 22 47.44 41.51 59 severe 15 4 19.23 7.55 19 78 53 131 Source DF -LogLikelihood RSquare (U) Model 2 2.92850 0.02222 Error 127 128.77783 C. Total 129 131.70633 Total Count 131 Test ChiSquare ProbaChiSq Likelihood Redo 5.857 0.0535 Pearson 5.635 0.0598 The approximate p-value is found to be: about .060 about .014 about .032 about .008 about .05A survey was conducted to investigate the severity of rodent problems in egg and poultry operations. A random sample of operators was selected, and the operators were classified according to the type of operation and the extent of the rodent population. A total of 78 egg operators and 53 turkey operators were classified and the summary information is: Count col % egg turkey total 26 mild 27 33.33 50.94 53 37 moderate 22 47.44 41.51 59 15 4 severe 19.23 7.55 19 78 53 131 Source DF -LogLikelihood RSquare (U) Model 2 2.92850 0.02222 Error 127 128.77783 C. Total 129 131.70633 Total Count 131 Test ChiSquare ProbaChiSq Likelihood Redo 5.857 0.0535 Pearson 5.635 0.0598 One reviewer of the study suggested that there may be a problem with the study because results from small operators were pooled with the results from large operators. Which of the following is NOT CORRECT?\fA survey was conducted to investigate the severity of rodent problems in egg and poultry operations. A random sample of operators was selected, and the operators were classified according to the type of operation and the extent of the rodent population. A total of 78 egg operators and 53 turkey operators were classified and the summary information is: Count col % egg turkey total 26 mild 27 33.33 50.94 53 moderate 37 22 47.44 41.51 59 15 severe 4 19.23 7.55 19 78 53 131 Source DF -LogLikelihood RSquare (U) Model 2 2.92850 0.02222 Error 127 128.77783 C. Total 129 131.70633 Total Count 131 Test ChiSquare ProbaChiSq Likelihood Redo 5.857 0.0535 Pearson 5.635 0.0598 The expected count in the (egg, mild infestation) cell is: about 26.00 about 33.33 about 53.00 about 31.55 about 78.00A survey was conducted to investigate the severity of rodent problems in egg and 3 poultry operations. A random sample of operators was selected, and the operators were classified according to the type of operation and the extent of the rodent population. A total of 78 egg operators and 53 turkey operators were classified and the summary information is: Count col % egg turkey total 26 mild 27 33.33 50.94 53 moderate 37 22 47.44 41.51 59 15 severe 14 19 19.23 7.55 78 53 131 Source DF -LogLikelihood RSquare (U) Model 12 2.92850 0.02222 Error 127 128.77783 C. Total 129 131.70633 Total Count 131 Test ChiSquare ProbaChiSq Likelihood Redo 5.857 0.0535 Pearson 5.635 0.0598 The value of the test statistic is: about 5.99 about 9.71 about 6.81 about 5.64 about 8.60