

Answered step by step
Verified Expert Solution
Question
1 Approved Answer
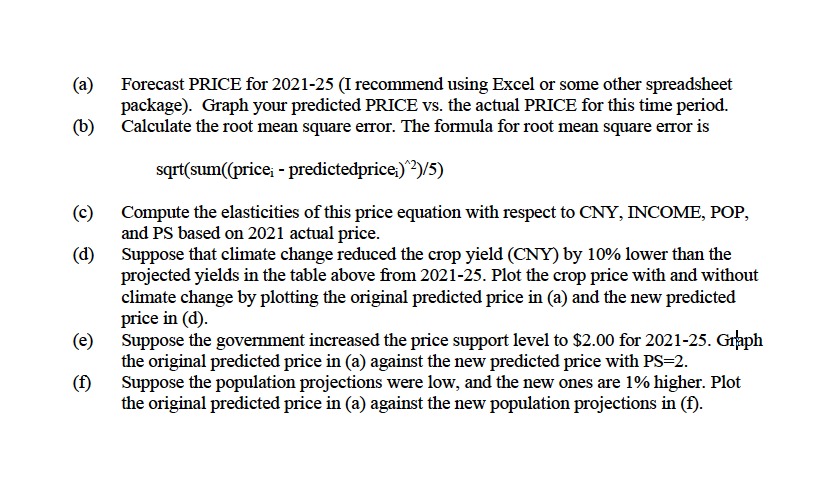
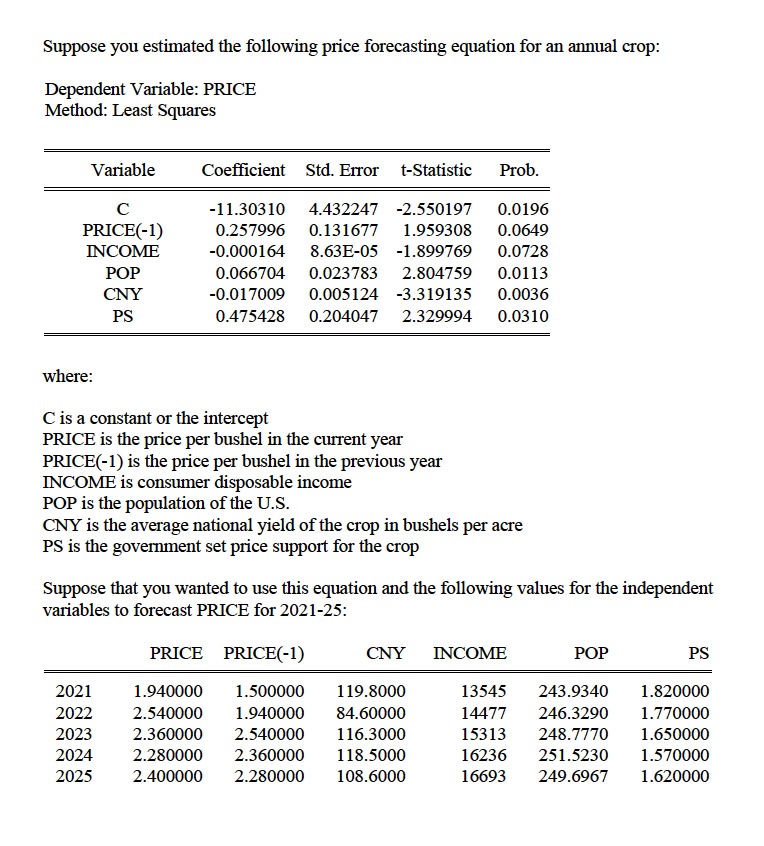
(a) Forecast PRICE for 2021-25 (I recommend using Excel or some other spreadsheet package). Graph your predicted PRICE vs. the actual PRICE for this time
Step by Step Solution
There are 3 Steps involved in it
Step: 1

Get Instant Access to Expert-Tailored Solutions
See step-by-step solutions with expert insights and AI powered tools for academic success
Step: 2

Step: 3
Ace Your Homework with AI
Get the answers you need in no time with our AI-driven, step-by-step assistance
Get Started
Operations Management A Supply Chain Process Approach
Authors: Joel D. Wisner
1st edition
978-1506354187, 1506354181, 1483383067, 978-1483383064