

Answered step by step
Verified Expert Solution
Question
1 Approved Answer
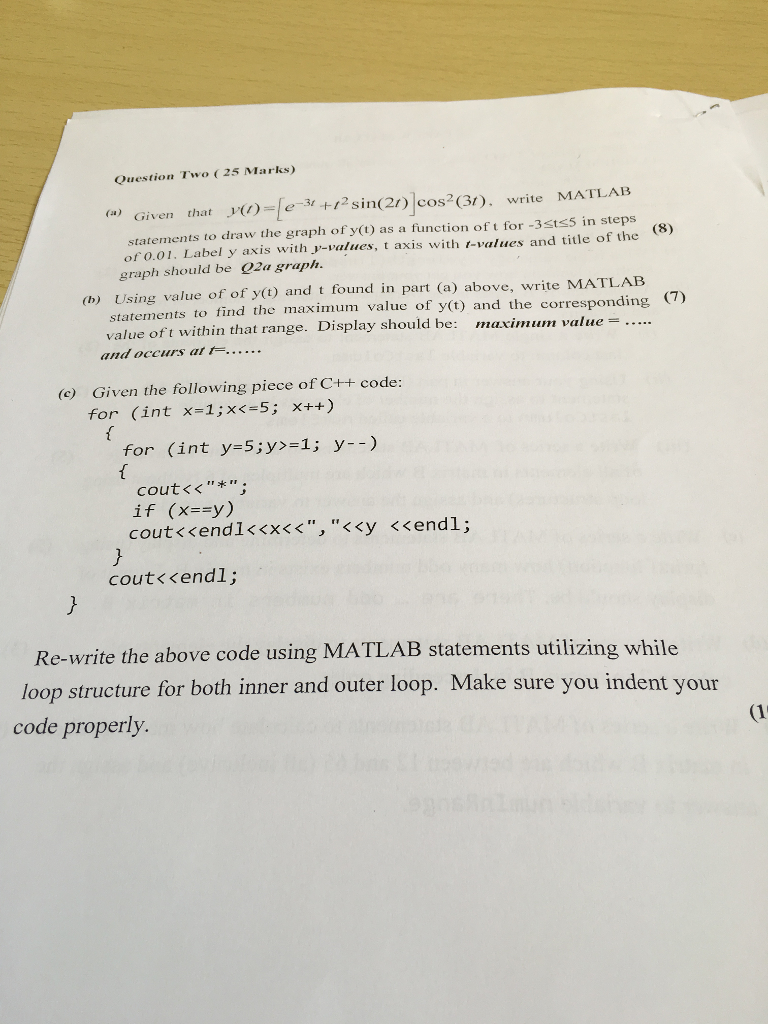
(a) Given that y(t) = [e^-3t + t^2 sin(2t)] cos^2(3t), write MATLAB statements to draw the graph of y(t) as a function of t for
Step by Step Solution
There are 3 Steps involved in it
Step: 1

Get Instant Access to Expert-Tailored Solutions
See step-by-step solutions with expert insights and AI powered tools for academic success
Step: 2

Step: 3
Ace Your Homework with AI
Get the answers you need in no time with our AI-driven, step-by-step assistance
Get Started
Probabilistic Databases
Authors: Dan Suciu, Dan Olteanu, Christopher Re, Christoph Koch
1st Edition
3031007514, 978-3031007514