

Question
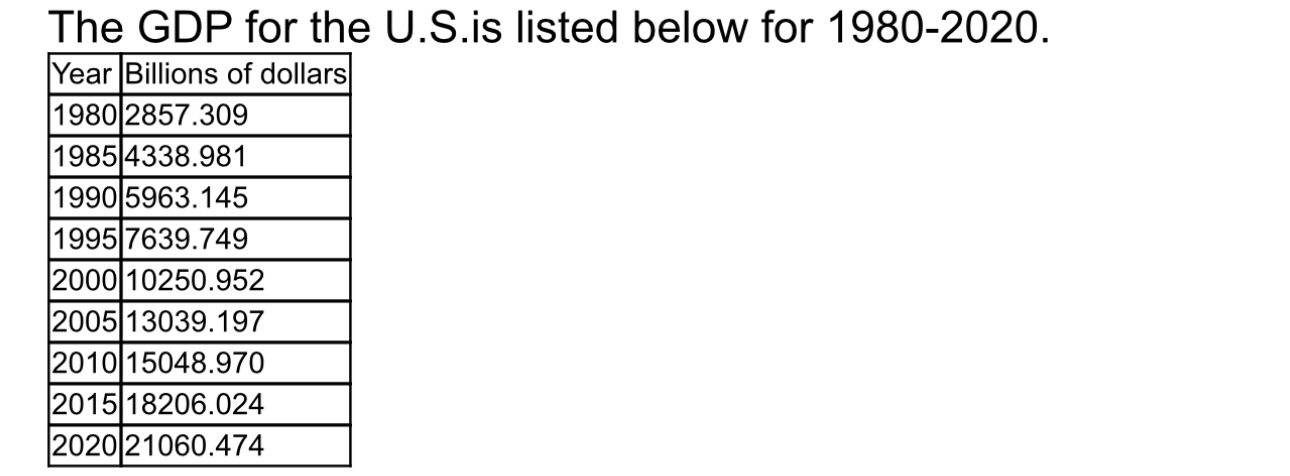
a. Graph a scatterplot and add the trendline. b. State the equation of the trendline c. Using Pearson's Correlation Coefficient, discuss the strength of the
a. Graph a scatterplot and add the trendline.
b. State the equation of the trendline
c. Using Pearson's Correlation Coefficient, discuss the strength of the relationship between pages and price.
d. What type of relationship, if any, is there between year and GDP?
Step by Step Solution
There are 3 Steps involved in it
Step: 1

Get Instant Access to Expert-Tailored Solutions
See step-by-step solutions with expert insights and AI powered tools for academic success
Step: 2

Step: 3
Ace Your Homework with AI
Get the answers you need in no time with our AI-driven, step-by-step assistance
Get Started
Holt McDougal Larson Geometry
Authors: Ron Larson, Laurie Boswell, Timothy D. Kanold, Lee Stiff
1st Edition
0547315171, 978-0547315171