

Question
A. Graph in terms of expected returns and standard deviation the possible set of portfolios if you restrict yourself to these two assets. B. What
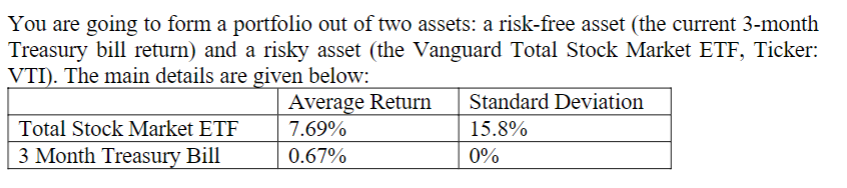
A. Graph in terms of expected returns and standard deviation the possible set of portfolios if you restrict yourself to these two assets. B. What would be the expected return and standard deviation of the portfolio if you hold 80% in the risky asset and 20% in the risk-free asset?
C. How much of your portfolio would you need to invest in the risky asset to have a portfolio with a standard deviation of 5%? (Hint: solve for the weight in the risky asset, w, using the fact that the weight in the risk-free asset is (1-w).)
D. How much of your portfolio would you need to invest in the risky asset to have a portfolio with an expected return of 10%?
You are going to form a portfolio out of two assets: a risk-free asset (the current 3-month Treasury bill return) and a risky asset (the Vanguard Total Stock Market ETF, Ticker: VTI). The main details are given below: Average Return Standard Deviation Total Stock Market ETF 7.69% 15.8% 3 Month Treasury Bill 0.67% 0%Step by Step Solution
There are 3 Steps involved in it
Step: 1

Get Instant Access to Expert-Tailored Solutions
See step-by-step solutions with expert insights and AI powered tools for academic success
Step: 2

Step: 3
Ace Your Homework with AI
Get the answers you need in no time with our AI-driven, step-by-step assistance
Get Started
The Amazon Fba Guide
Authors: Nina Klose
1st Edition
1676841423, 978-1676841425