

Answered step by step
Verified Expert Solution
Question
1 Approved Answer
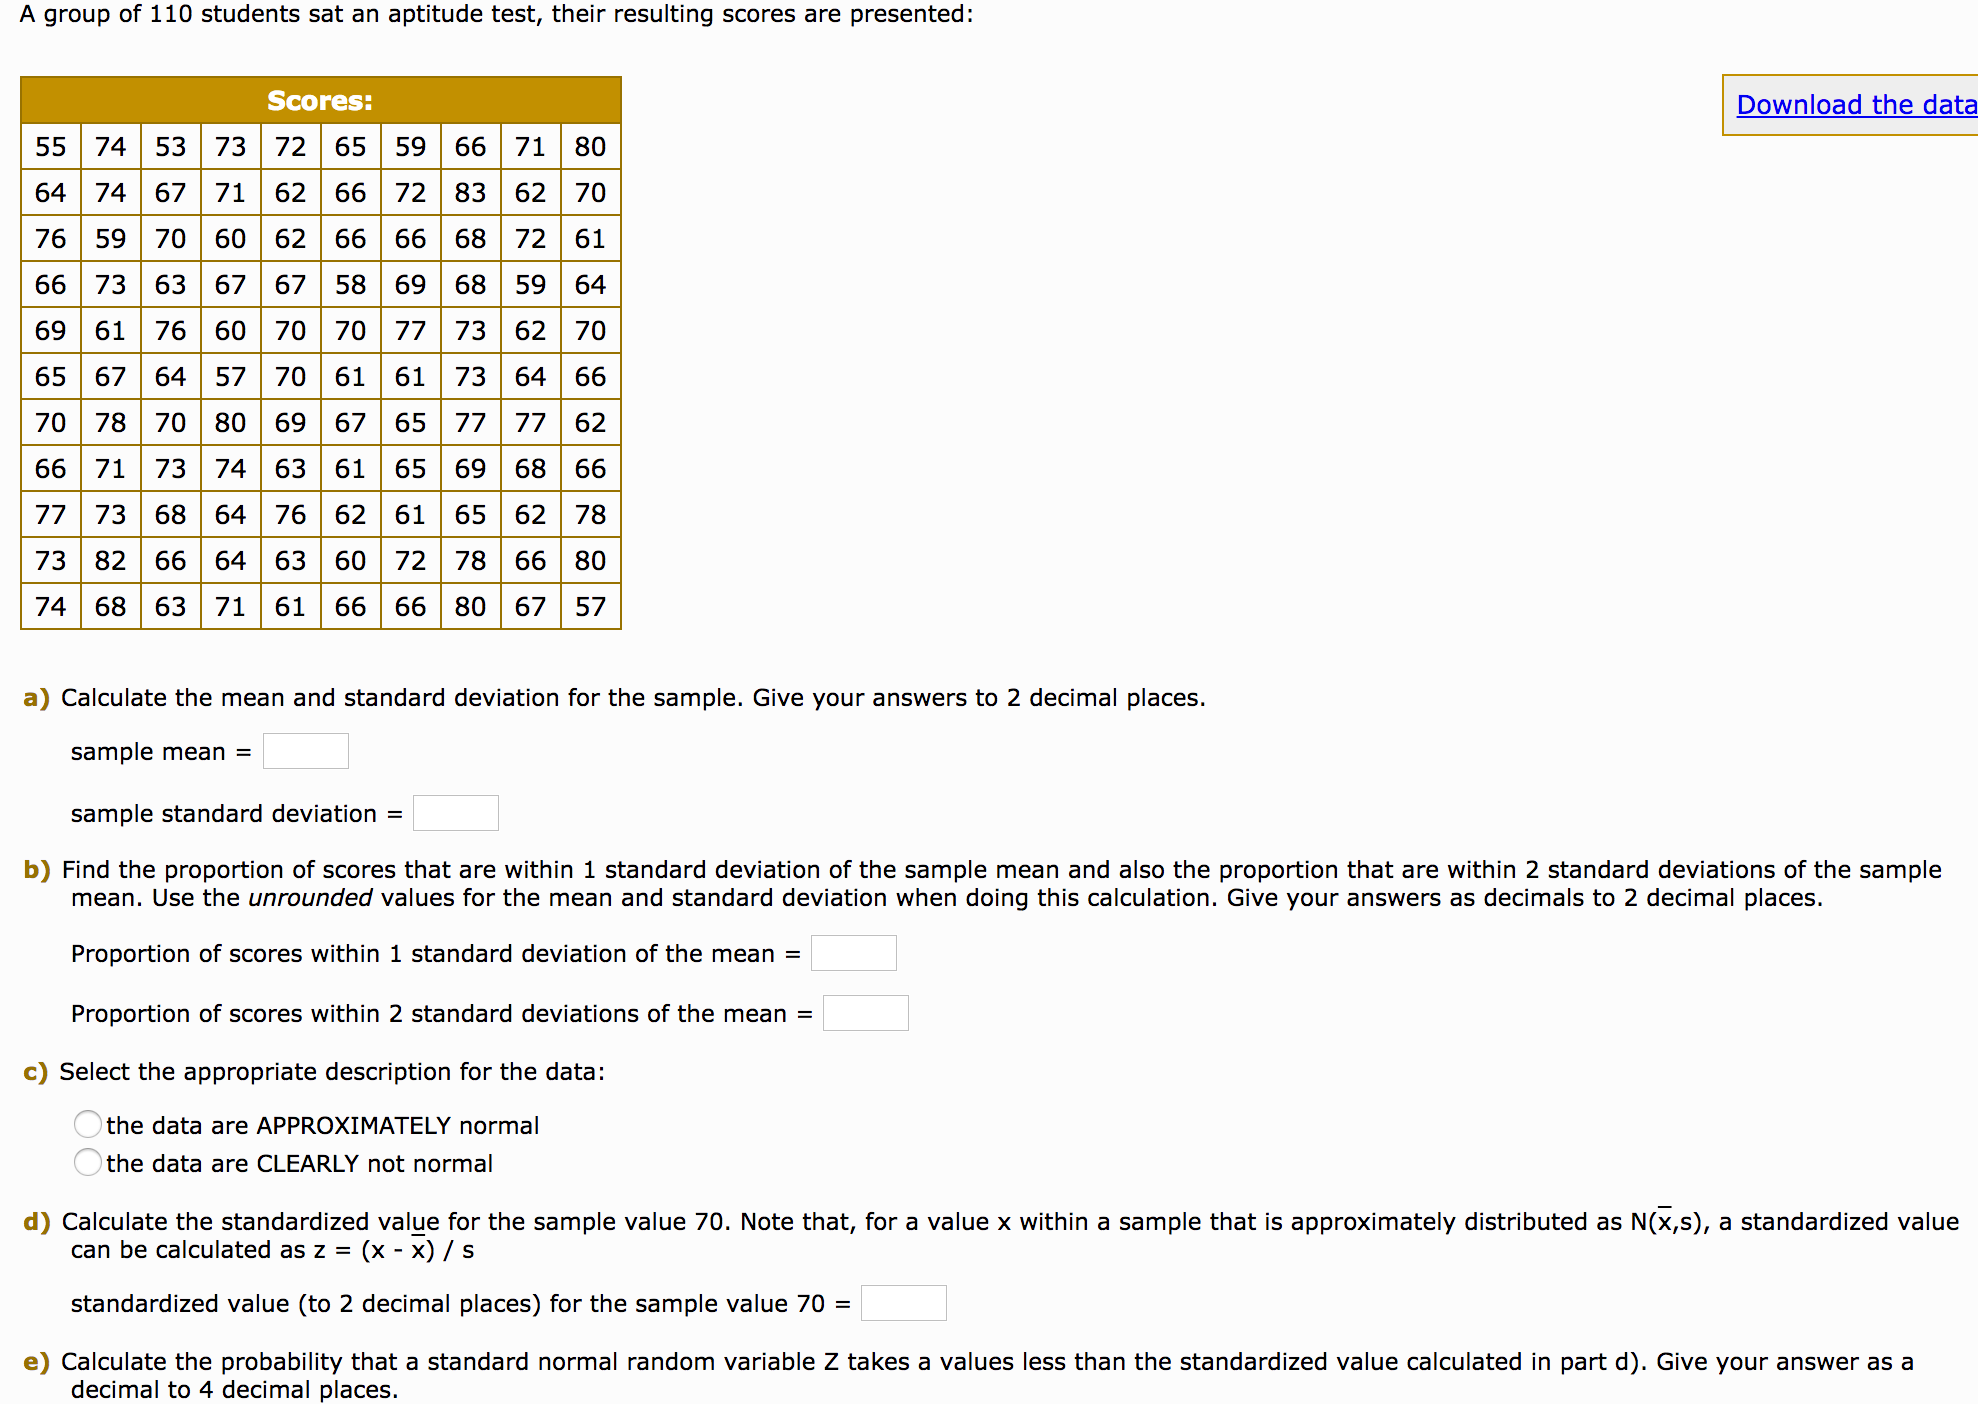
A group of 110 students sat an aptitude test, their resulting scores are presented: 55 64 74 74 53 67 73 71 Scores: 72 62
Step by Step Solution
There are 3 Steps involved in it
Step: 1

Get Instant Access to Expert-Tailored Solutions
See step-by-step solutions with expert insights and AI powered tools for academic success
Step: 2

Step: 3
Ace Your Homework with AI
Get the answers you need in no time with our AI-driven, step-by-step assistance
Get Started
College Algebra Graphs and Models
Authors: Marvin L. Bittinger, Judith A. Beecher, David J. Ellenbogen, Judith A. Penna
5th edition
321845404, 978-0321791009, 321791002, 978-0321783950, 321783956, 978-0321845405