Answered step by step
Verified Expert Solution
Link Copied!

Question

1 Approved Answer

A horticulturist is studying the relationship between tomato plant height and fertilizer amount. Thirty tomato plants grown in similar conditions were subjected to various amounts
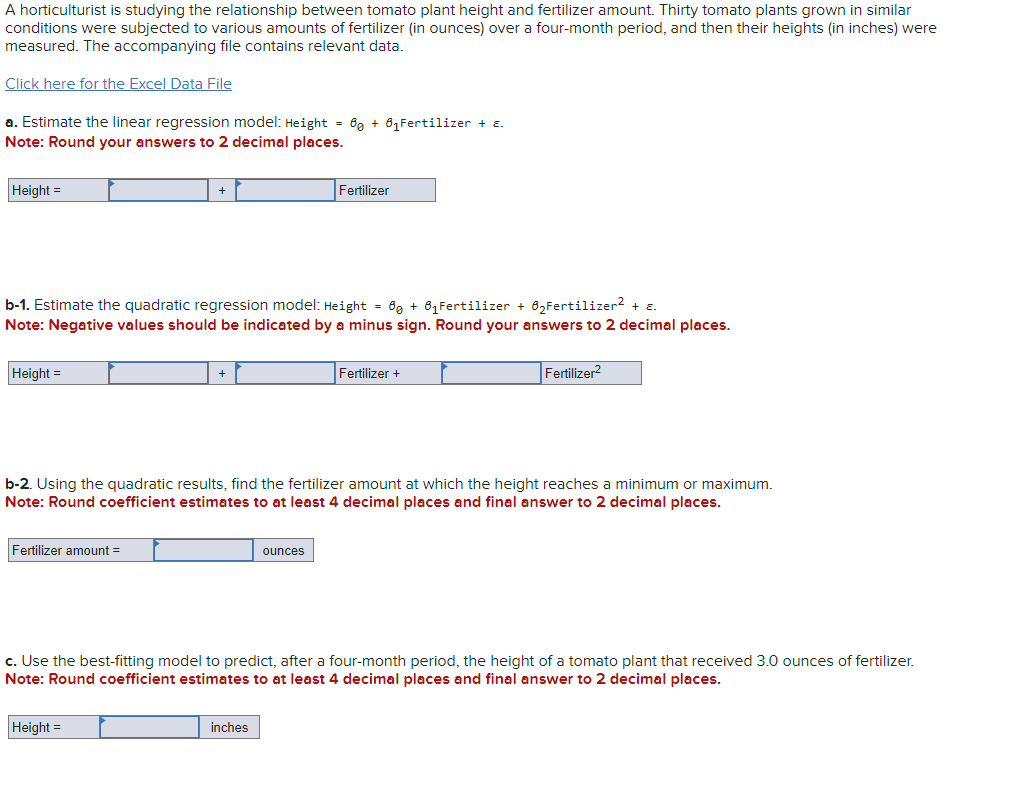
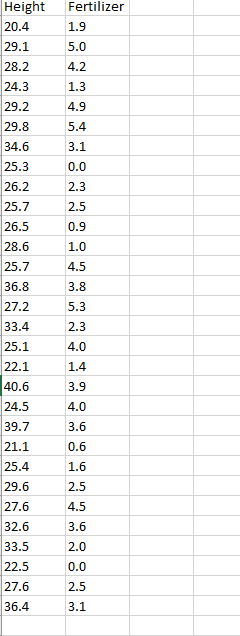
image text in transcribedimage text in transcribed

A horticulturist is studying the relationship between tomato plant height and fertilizer amount. Thirty tomato plants grown in similar conditions were subjected to various amounts of fertilizer (in ounces) over a four-month period, and then their heights (in inches) were measured. The accompanying file contains relevant data. Click here for the Excel Data File a. Estimate the linear regression model: Height =0+1 Fertilizer +. Note: Round your answers to 2 decimal places. b-1. Estimate the quadratic regression model: Height =+1 Fertilizer +2 Fertilizer 2+. Note: Negative values should be indicated by a minus sign. Round your answers to 2 decimal places. b-2. Using the quadratic results, find the fertilizer amount at which the height reaches a minimum or maximum. Note: Round coefficient estimates to at least 4 decimal places and final answer to 2 decimal places. c. Use the best-fitting model to predict, after a four-month period, the height of a tomato plant that received 3.0 ounces of fertilizer. Note: Round coefficient estimates to at least 4 decimal places and final answer to 2 decimal places. Height Fertilizer 20.41.9 29.15.0 \begin{tabular}{ll} 28.2 & 4.2 \\ \hline \end{tabular} \begin{tabular}{|l|l|} \hline 24.3 & 1.3 \\ \hline 29.2 & 4.9 \\ \hline 29.8 & 5.4 \\ \hline \end{tabular} \begin{tabular}{|l|l} 34.6 & 3.1 \\ \hline \end{tabular} \begin{tabular}{ll} 25.3 & 0.0 \\ \hline \end{tabular} \begin{tabular}{l|l} 26.2 & 2.3 \\ \hline \end{tabular} \begin{tabular}{|l|l|} \hline 25.7 & 2.5 \\ \hline 26.5 & 0.9 \\ \hline \end{tabular} \begin{tabular}{|l|l|} \hline 28.6 & 1.0 \\ \hline 25.7 & 4.5 \\ \hline 36.8 & 3.8 \\ \hline \end{tabular} \begin{tabular}{ll} 27.2 & 5.3 \\ \hline \end{tabular} \begin{tabular}{l|l} 33.4 & 2.3 \\ \hline \end{tabular} 25.14.0 22.11.4 40.63.9 24.54.0 39.73.6 \begin{tabular}{l|l} 21.1 & 0.6 \\ \hline \end{tabular} \begin{tabular}{l|l} 25.4 & 1.6 \end{tabular} 29.62.5 27.64.5 \begin{tabular}{l|l} 32.6 & 3.6 \end{tabular} \begin{tabular}{l|l} 33.5 & 2.0 \end{tabular} \begin{tabular}{l|l} 22.5 & 0.0 \end{tabular} 27.62.5 \begin{tabular}{l|l} 36.4 & 3.1 \end{tabular}

Step by Step Solution

There are 3 Steps involved in it

Step: 1

blur-text-image

Get Instant Access to Expert-Tailored Solutions

See step-by-step solutions with expert insights and AI powered tools for academic success

Step: 2

blur-text-image

Step: 3

blur-text-image

Ace Your Homework with AI

Get the answers you need in no time with our AI-driven, step-by-step assistance

Get Started

Recommended Textbook for

Process Dynamics And Control

Authors: Dale E. Seborg, Thomas F. Edgar, Duncan A. Mellichamp, Francis J. Doyle

4th Edition

1119385561, 1119385563, 9781119285953, 978-1119385561

More Books

Students also viewed these Chemical Engineering questions