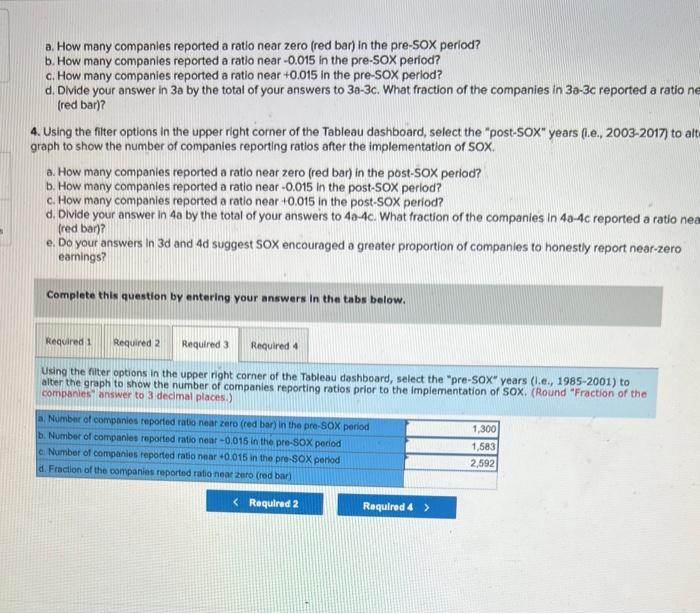
a. How many companies reported a ratio near zero (red bar) in the pre-SOX period? b. How many companies reported a ratio near 0.015 in the pre-SOX period? c. How many companies reported a ratio near +0.015 in the pre-SOX period? d. Dlvide your answer in 3a by the total of your answers to 3a3c. What fraction of the companies in 3a3c reported a ratio n (red bar)? 4. Using the filter options in the upper right corner of the Tableau dashboard, select the "post-SOX" years (i.e., 2003-2017) to al graph to show the number of companies reporting ratios after the implementation of SOX. a. How many companies reported a ratio near zero (red bar) in the post-5OX period? b. How many companies reported a ratio near 0.015 in the post-SOX period? c. How many companies reported a ratio near +0.015 in the post-SOX period? d. Divide your answer in 4a by the total of your answers to 4a4c. What fraction of the companies in 4a4c reported a ratio ne (red bar)? e. Do your answers in 3d and 4d suggest SOX encouraged a greater proportion of companies to honestly report near-zero earnings? Complete this question by entering your answers in the tabs below. Using the fiter options in the upper right corner of the Tableau dashboard, select the "pre-SoX" years (1.e., 1985-2001) to alter the graph to show the number of companies reporting ratios prior to the implementation of SOX. (Round "Fraction of the companies answer to 3 decimal places.) a. How many companies reported a ratio near zero (red bar) in the pre-SOX period? b. How many companies reported a ratio near 0.015 in the pre-SOX period? c. How many companies reported a ratio near +0.015 in the pre-SOX period? d. Dlvide your answer in 3a by the total of your answers to 3a3c. What fraction of the companies in 3a3c reported a ratio n (red bar)? 4. Using the filter options in the upper right corner of the Tableau dashboard, select the "post-SOX" years (i.e., 2003-2017) to al graph to show the number of companies reporting ratios after the implementation of SOX. a. How many companies reported a ratio near zero (red bar) in the post-5OX period? b. How many companies reported a ratio near 0.015 in the post-SOX period? c. How many companies reported a ratio near +0.015 in the post-SOX period? d. Divide your answer in 4a by the total of your answers to 4a4c. What fraction of the companies in 4a4c reported a ratio ne (red bar)? e. Do your answers in 3d and 4d suggest SOX encouraged a greater proportion of companies to honestly report near-zero earnings? Complete this question by entering your answers in the tabs below. Using the fiter options in the upper right corner of the Tableau dashboard, select the "pre-SoX" years (1.e., 1985-2001) to alter the graph to show the number of companies reporting ratios prior to the implementation of SOX. (Round "Fraction of the companies answer to 3 decimal places.)


