

Answered step by step
Verified Expert Solution
Question
1 Approved Answer
a. How would you find out what cost of goods sold is for the years 2010-2014? b. How would you find out what average inventory
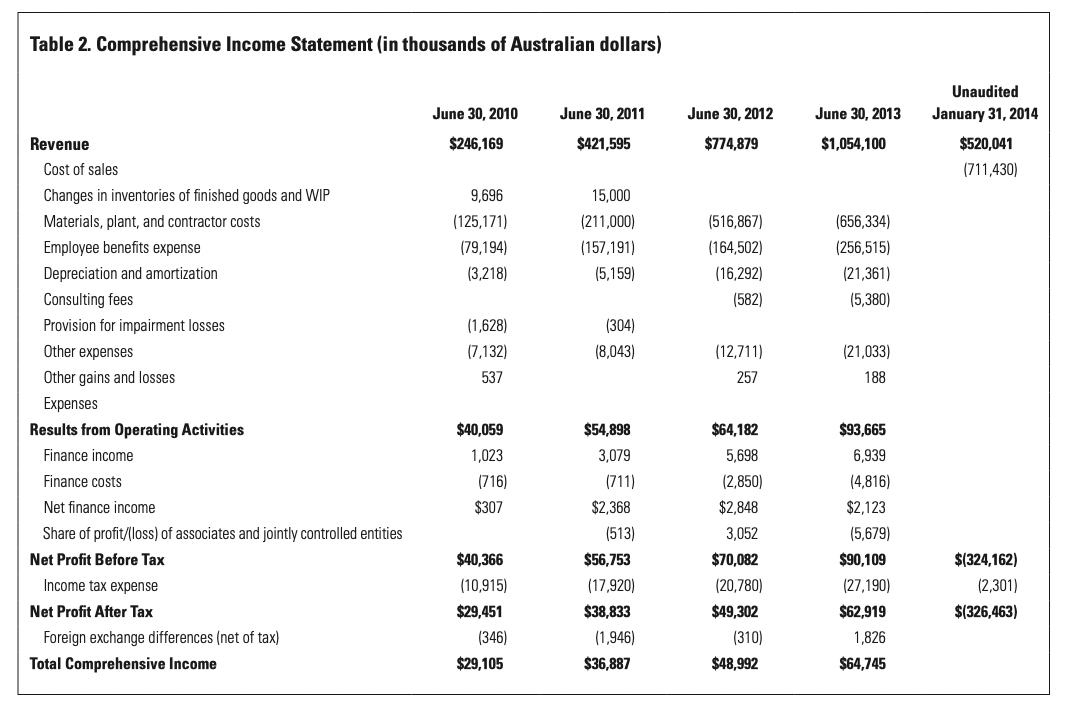
a. How would you find out what cost of goods sold is for the years 2010-2014?
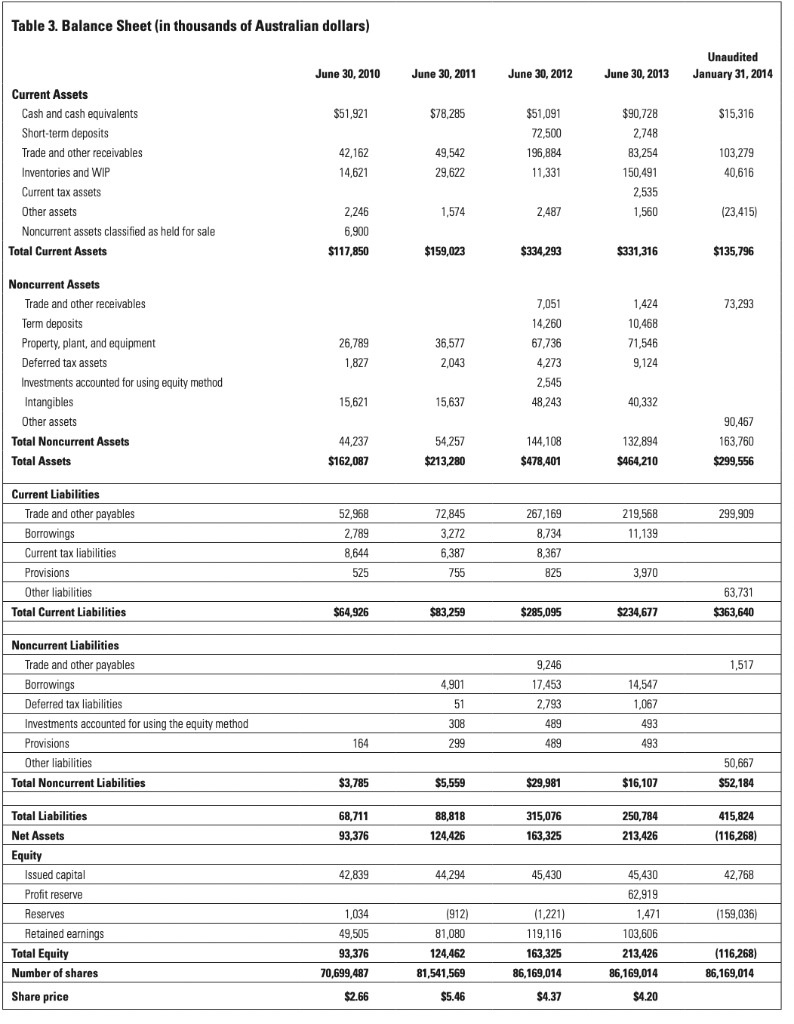
b. How would you find out what average inventory is for the years 2010 - 2014?
Table 2. Comprehensive Income Statement (in thousands of Australian dollars) June 30, 2010 June 30, 2011 June 30, 2012 June 30, 2013 Unaudited January 31, 2014 $520,041 (711,430) $246,169 $421,595 $774,879 $1,054,100 9,696 (516,867) (125,171) (79,194) (3,218) 15,000 (211,000) (157,191) (5,159) (164,502) Revenue Cost of sales Changes in inventories of finished goods and WIP Materials, plant, and contractor costs Employee benefits expense Depreciation and amortization Consulting fees Provision for impairment losses Other expenses Other gains and losses Expenses Results from Operating Activities Finance income (656,334) (256,515) (21,361) (5,380) (16,292) (582) (1,628) (7,132) 537 (304) (8,043) (12,711) 257 (21,033) 188 $40,059 1,023 (716) $307 Finance costs $64,182 5,698 (2,850) $2,848 3,052 Net finance income Share of profit/(loss) of associates and jointly controlled entities Net Profit Before Tax Income tax expense Net Profit After Tax Foreign exchange differences (net of tax) Total Comprehensive Income $54,898 3,079 (711) $2,368 (513) $56,753 (17,920) $38,833 (1,946) $36,887 $93,665 6,939 (4,816) $2,123 (5,679) $90,109 (27,190) $62,919 1,826 $40,366 (10,915) $29,451 (346) $29,105 $70,082 (20,780) $49,302 (310) $(324,162) (2,301) $(326,463) $48,992 $64,745 Table 3. Balance Sheet (in thousands of Australian dollars) June 30, 2010 June 30, 2011 Unaudited January 31, 2014 June 30, 2012 June 30, 2013 $51,921 $78,285 $15,316 $51,091 72,500 196,884 11,331 42,162 Current Assets Cash and cash equivalents Short-term deposits Trade and other receivables Inventories and WIP Current tax assets Other assets Noncurrent assets classified as held for sale Total Current Assets 49,542 $90,728 2,748 83,254 150,491 2,535 1,560 103,279 40,616 14,621 29.622 1,574 2,487 (23,415) 2,246 6,900 $117,850 $159,023 $334 293 $331,316 $135,796 73,293 1,424 10,468 71,546 26,789 36,577 2,043 7,051 14,260 67.736 4,273 2,545 48,243 1,827 Noncurrent Assets Trade and other receivables Term deposits Property, plant, and equipment Deferred tax assets Investments accounted for using equity method Intangibles Other assets Total Noncurrent Assets Total Assets 9,124 15,621 15,637 40,332 44,237 54,257 $213,280 144,108 $478,401 132,894 $464,210 90,467 163,760 $299,556 $162,087 52,968 299,909 219,568 11,139 Current Liabilities Trade and other payables Borrowings Current tax liabilities Provisions Other liabilities Total Current Liabilities 2,789 8,644 525 72,845 3,272 6,387 755 267,169 8,734 8,367 825 3,970 63,731 $363,640 $64.926 $83,259 $285,095 $234,677 1,517 4,901 51 9,246 17,453 2,793 14,547 1,067 Noncurrent Liabilities Trade and other payables Borrowings Deferred tax liabilities Investments accounted for using the equity method Provisions Other liabilities Total Noncurrent Liabilities 308 489 493 164 299 489 493 50,667 $52,184 $3,785 $5,559 $29,981 $16,107 68,711 88,818 124,426 315,076 163,325 250,784 213,426 415,824 (116 268) 93,376 42,839 44,294 45,430 42,768 Total Liabilities Net Assets Equity Issued capital Profit reserve Reserves Retained earnings Total Equity Number of shares 45,430 62,919 1,471 (159,036) 1,034 49.505 1912) 81,080 (1,221) 119,116 103,606 213,426 93,376 70,699,487 124,462 81,541,569 163,325 86,169,014 (116,268) 86,169,014 86,169,014 Share price $2.66 $5.46 $4.37 $4.20Step by Step Solution
There are 3 Steps involved in it
Step: 1

Get Instant Access to Expert-Tailored Solutions
See step-by-step solutions with expert insights and AI powered tools for academic success
Step: 2

Step: 3
Ace Your Homework with AI
Get the answers you need in no time with our AI-driven, step-by-step assistance
Get Started
Kamishibai Boards A Lean Visual Management System That Supports Layered Audits
Authors: Joseph Niederstadt
1st Edition
1482205297, 978-1482205299