

Question
a. Identify the current operating liabilities (only include liabilities that will impact operating expenses) for each company and the applicable common-size percentage for each operating
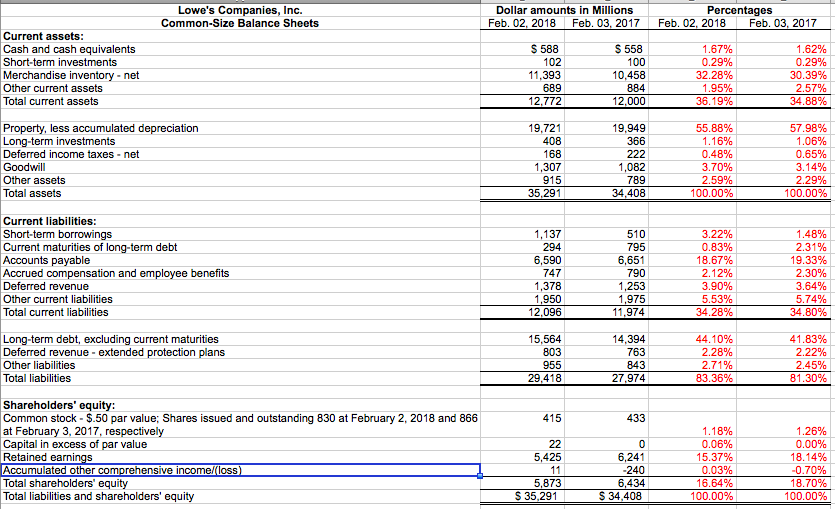

a. Identify the current operating liabilities (only include liabilities that will impact operating expenses) for each company and the applicable common-size percentage for each operating liability in the current year using your common-size balance sheet from part 2 of the financial analysis case. Explain why you picked these as the current operating liabilities. Operating liabilities were discussed in Module 4, but relates to module 7 with the continuation of the discussion on liabilities.
|
| List current operating liabilities and applicable common-size percentage for each account |
| HD |
|
| LOW |
|
Explanation:
b. Identify the largest current operating liability for each company and explain why this current operating liability is so large compared to the other current operating liabilities.
c. What current liabilities did you not include in your analysis of current operating liabilities? Make sure you list out each of the current liabilities that were not included in a. Explain why you did not include them.
| HD |
|
| LOW |
|
Explanation:
Lowe's Companies, Inc. Common-Size Balance Sheets Dollar amounts in Millions Feb. 02, 2018 Feb. 03, 2017 Percentages Feb. 02, 2018 Feb. 03, 2017 Current assets Cash and cash equivalents Short-term investments Merchandise inventory-net Other current assets Total current assets 1.67% 0.29% 32.28% 0.29% 30.39% 2.57% 34.88% 10,458 884 11,393 12,772 57.98% 1.06% 0.65% Property, less accumulated depreciation Long-term investments Deferred income taxes net Goodwill Other assets Total assets 19,949 366 55.88% 408 1,307 35,291 1,082 789 34,408 0.48% 3.70% 2.59% 100.00% 2.29% 100.00% Current liabilities Short-term borrowings Current maturities of long-term debt Accounts payable Accrued compensation and employee benefits Deferred revenue Other current liabilities Total current liabilities 1.48% 2.31% 19.33% 2.30% 3.64% 3.22% 0.83% 18.67% 294 6,651 790 1,253 1.975 11,974 747 1,378 12,096 15,564 3.90% 34.28% 34.80% Long-term debt, excluding current maturities Deferred revenue-extended protection plans Other liabilities Total liabilities 44. 1 0% 2.28% 41.83% 2.22% 27,974 Shareholders' equity: Common stock-$.50 par value; Shares issued and outstanding 830 at February 2, 2018 and 866 at February 3,2017, respectively Capital in excess of par value Retained earnin Accumulated other comprehensive income/(loss Total shareholders' equity Total liabilities and shareholders' equity 433 0.06% 15.37% 0.00% -0.70% 100.00% 5,425 5,873 16.64% 100.00% S 34,408 Home Depot Inc. Common-Size Balance Sheets Dollar amounts in Millions Jan. 28, 2018 Jan. 29. 2017 Percentages Jan. 28, 2018 Jan. 29, 2017 Current assets Cash and cash equivalents Recervables, net Merchandise inventories Other current assets Total current assets S 2,538 2,029 12,549 8.07% 4.38% -28.63% 5.91% 4.72% 29.21% 12,748 638 17,724 Net property and equipment Goodwill Other assets Total assets 42.52% 49.57% 2.80% 22,075 2,275 2,093 1,235 42,966 51.00% 4.87% 2.87% 44,529 Current Liabilities: Shortterm debt Accounts payable Accrued salaries and related expenses Sales taxes payable Deferred revenue Income taxes payable Current installments of long-term debt Other accrued expenses Total current liabilities 1,559 3.50% 16.27% 3.68% 18.29% 3.45% 520 508 1,669 25 3.88% 0.06% 1.26% 4,05% 54 270% 4.87% 0.00% 54.50% 0.99% Long-term debt, excluding current installments Deferred income taxes Other long-term liabilities Total liabilities 24,267 22,349 296 1,855 38,633 52. 02% 0.69% 43,075 96.73% 89.92% Common stock, par value S0.05; authorized: 10,000 shares; issued: 1,780 shares at January 28 2018 and 1,776 shares at January 29, 2017 Paid-in capital Retained earnings Accumulated other comprehensive loss Treasury stock, at cost, 622 shares at January 28, 2018 and 573 shares at January 29, 2017 Total stockholders' equity Total liabilities and stockholders' equi 89 9,787 867 4,333 0.20% 22.89% 89.68% 1.27% 108.24% 0.20% 22.78% 82.67% 2.02% 93.55% 10.08% 100.00% 39,935 566 44.529 S 42,966 100.00%
Step by Step Solution
There are 3 Steps involved in it
Step: 1

Get Instant Access to Expert-Tailored Solutions
See step-by-step solutions with expert insights and AI powered tools for academic success
Step: 2

Step: 3
Ace Your Homework with AI
Get the answers you need in no time with our AI-driven, step-by-step assistance
Get Started
Introduction To Financial Accounting Multiple Choice Questions
Authors: George Fossi Kamga
1st Edition
6205912481, 978-6205912485