Answered step by step
Verified Expert Solution
Question
1 Approved Answer
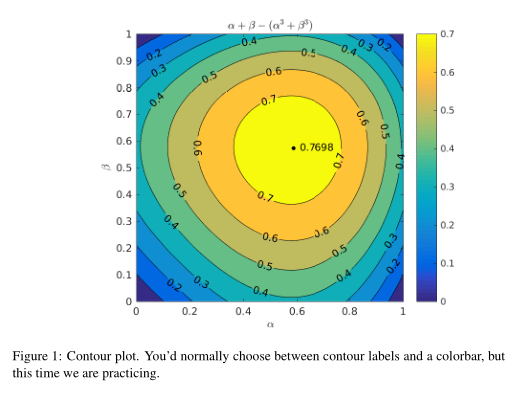
A. In this problem we continue our exploration of MATLAB's plotting capabilities by looking at an alternative to the surface plot: the contour plot. Write
A. In this problem we continue our exploration of MATLAB's plotting capabilities by looking at an alternative to the surface plot: the contour plot. Write a MATLAB script contourplot.m that plots the following surface for 0-?, ?-1. You should use the meshgrid (as in the previous assignment) and contourf MATLAB functions. Use a step of 0.001 for both a and B Add contour labels (with clabel; check the documentation) and a colorbar to your plot. Mark the point where ? is maximum with a dot and write the maximum value next to it. Use max and logical addressing to get the right values for ?, a, and ? (This computation is approximate because the value of is only checked at the grid points.) Once the coordinates of the maximum and its value are in maxa, maxb, and maxz, you can annotate the plot with text (maxa, maxb, [ , \bullet , , num2str (maxz) ] ? Let the title of your plot be a + ?-(a3 + ?*). Use the latex interpreter. The Greek letters are obtained by typing a backslash in front of their names. The final result should look like Figure[ Submit your script
Step by Step Solution
There are 3 Steps involved in it
Step: 1
Get Instant Access to Expert-Tailored Solutions
See step-by-step solutions with expert insights and AI powered tools for academic success
Step: 2
Step: 3
Ace Your Homework with AI
Get the answers you need in no time with our AI-driven, step-by-step assistance
Get Started