

Answered step by step
Verified Expert Solution
Question
1 Approved Answer
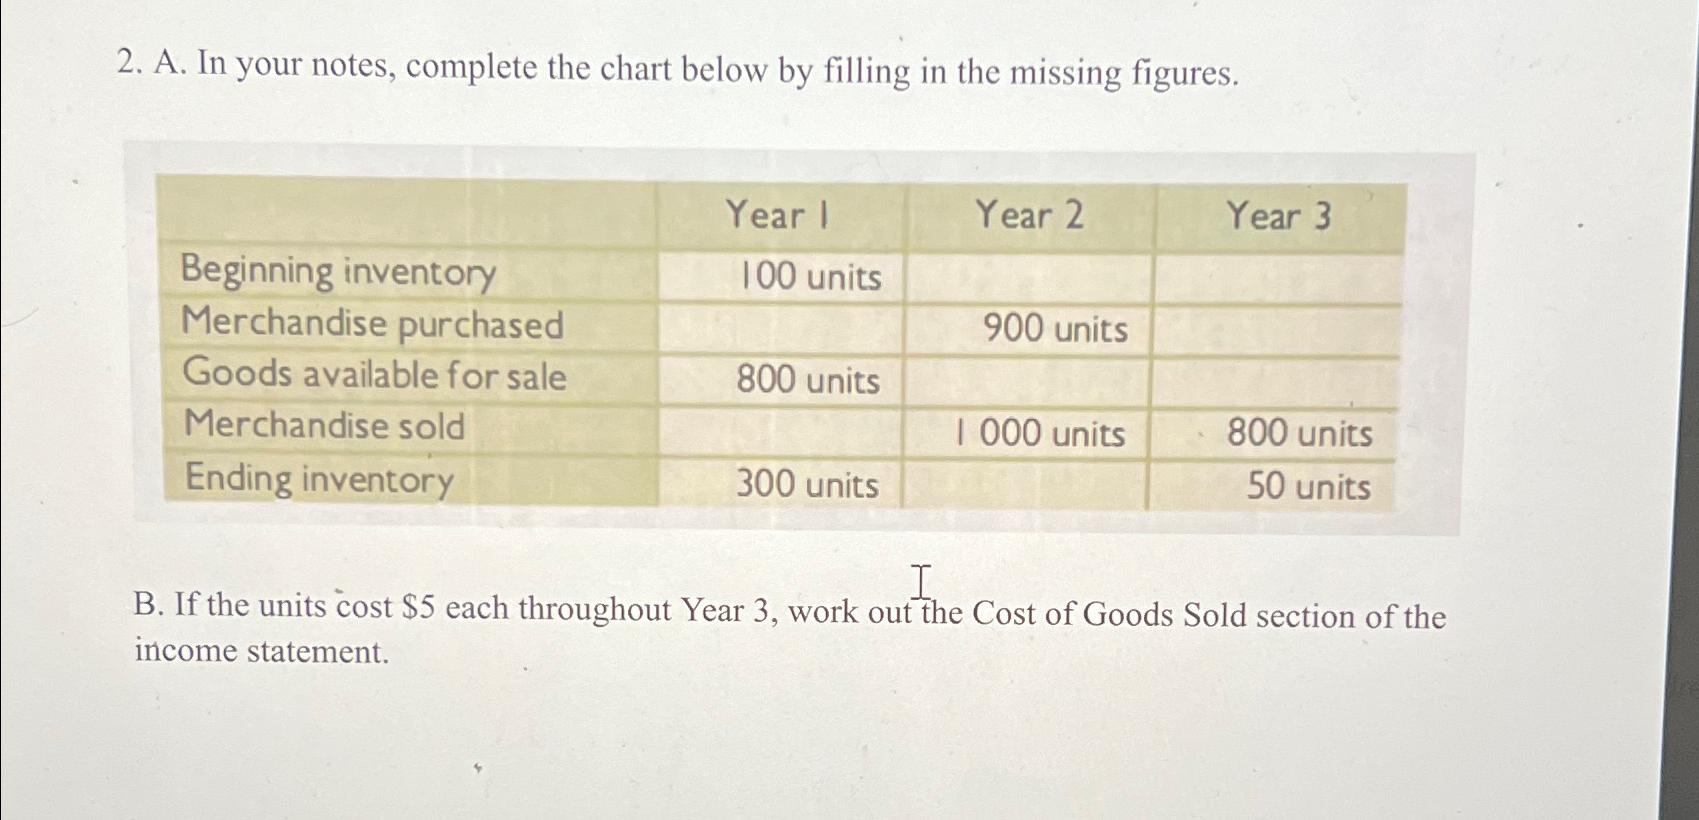
A . In your notes, complete the chart below by filling in the missing figures. table [ [ , Year 1 , Year 2
A In your notes, complete the chart below by filling in the missing figures.
tableYear Year Year Beginning inventory, units,,Merchandise purchased,, units,Goods available for sale, units,,Merchandise sold,, units, unitsEnding inventory, units,, units
B If the units cost $ each throughout Year work out the Cost of Goods Sold section of the income statement.
Step by Step Solution
There are 3 Steps involved in it
Step: 1

Get Instant Access to Expert-Tailored Solutions
See step-by-step solutions with expert insights and AI powered tools for academic success
Step: 2

Step: 3
Ace Your Homework with AI
Get the answers you need in no time with our AI-driven, step-by-step assistance
Get Started
Cost Accounting A Managerial Emphasis
Authors: Charles T. Horngren, Srikant M.Dater, George Foster, Madhav
13th Edition
8120335643, 136126634, 978-0136126638