Answered step by step
Verified Expert Solution
Question
1 Approved Answer
A large sales organization has the following data and seasonal index. 8 represents 8.000.000 TL in the table. a. Compute the seasonal index using only
A large sales organization has the following data and seasonal index. 8 represents 8.000.000 TL in the table.
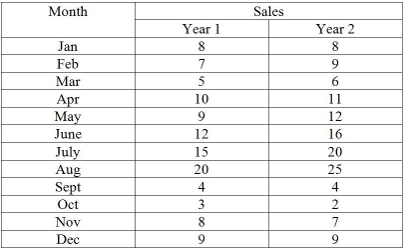
a. Compute the seasonal index using only year 1 data.
b. Determine the deseasonalized demand values using year 2 data and year 1's seasonal indices.
c. Determine the trend line on year 2's deseasonalized data.
d. Forecast the sales for the first 3 months of year 3, adjusting for seasonality.
\begin{tabular}{|c|c|c|} \hline \multirow{2}{*}{ Month } & \multicolumn{2}{|c|}{ Sales } \\ \cline { 2 - 3 } & Year 1 & Year 2 \\ \hline Jan & 8 & 8 \\ \hline Feb & 7 & 9 \\ \hline Mar & 5 & 6 \\ \hline Apr & 10 & 11 \\ \hline May & 9 & 12 \\ \hline June & 12 & 16 \\ \hline July & 15 & 20 \\ \hline Aug & 20 & 25 \\ \hline Sept & 4 & 4 \\ \hline Oct & 3 & 2 \\ \hline Nov & 8 & 7 \\ \hline Dec & 9 & 9 \\ \hline \end{tabular}Step by Step Solution
There are 3 Steps involved in it
Step: 1

Get Instant Access to Expert-Tailored Solutions
See step-by-step solutions with expert insights and AI powered tools for academic success
Step: 2

Step: 3
Ace Your Homework with AI
Get the answers you need in no time with our AI-driven, step-by-step assistance
Get Started