Answered step by step
Verified Expert Solution
Question
1 Approved Answer
A local company of sales professionals in Abu Dhabi conducted a survey of its employees to study the relationship, if any, between the years of
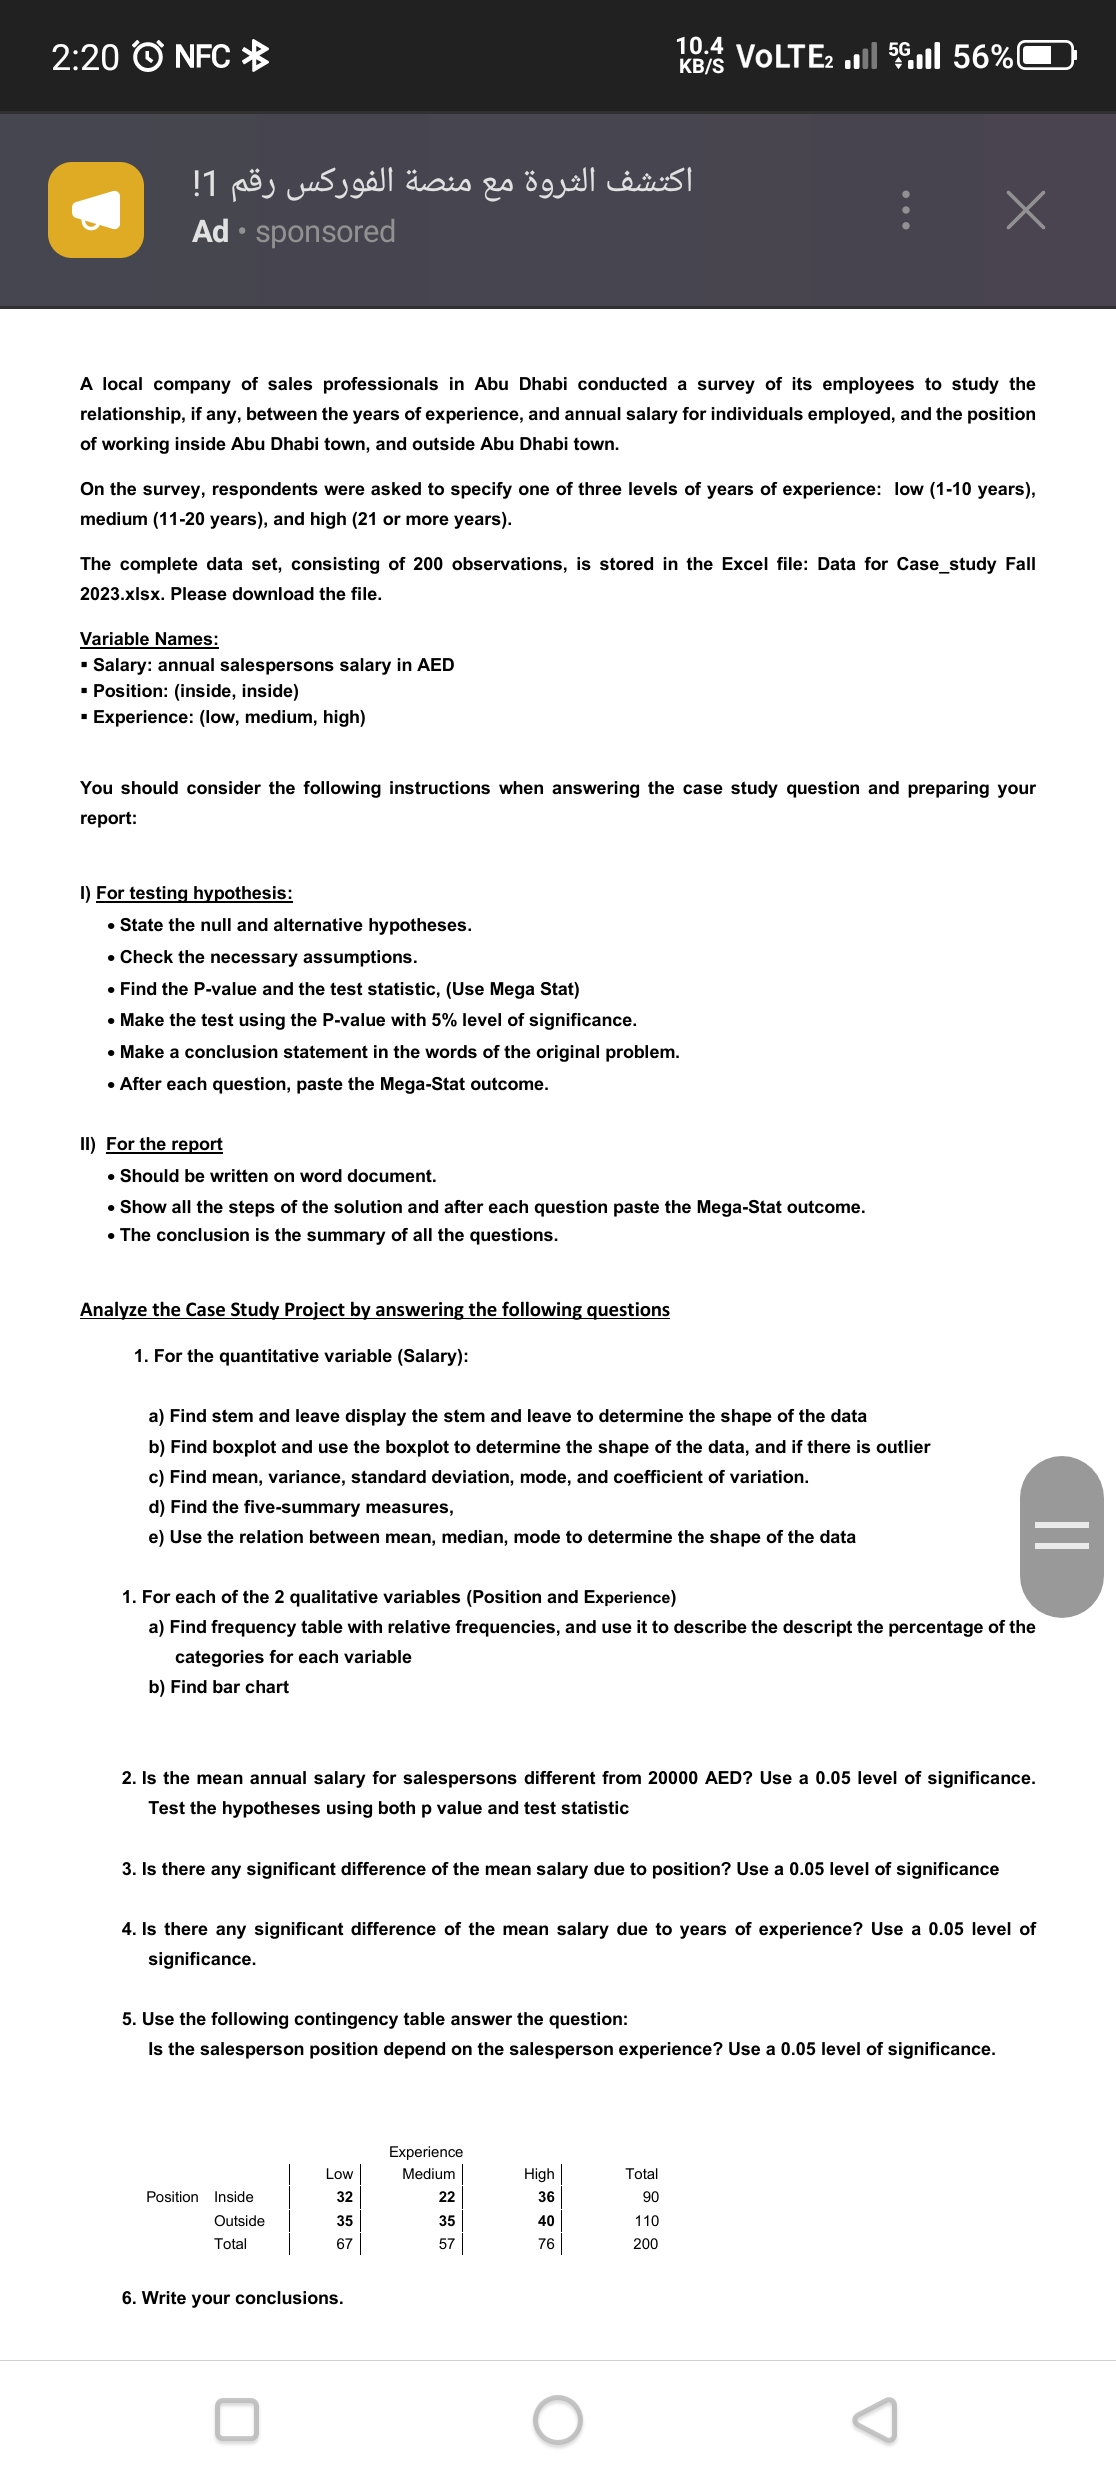
 A local company of sales professionals in Abu Dhabi conducted a survey of its employees to study the relationship, if any, between the years of experience, and annual salary for individuals employed, and the position of working inside Abu Dhabi town, and outside Abu Dhabi town. On the survey, respondents were asked to specify one of three levels of years of experience: low (1-10 years), medium (11-20 years), and high (21 or more years). The complete data set, consisting of 200 observations, is stored in the Excel file: Data for Case_study Fall 2023.xlsx. Please download the file. Variable Names: - Salary: annual salespersons salary in AED - Position: (inside, inside) - Experience: (low, medium, high) You should consider the following instructions when answering the case study question and preparing your report: I) For testing hypothesis: - State the null and alternative hypotheses. - Check the necessary assumptions. - Find the P-value and the test statistic, (Use Mega Stat) - Make the test using the P-value with 5% level of significance. - Make a conclusion statement in the words of the original problem. - After each question, paste the Mega-Stat outcome. II) For the report - Should be written on word document. - Show all the steps of the solution and after each question paste the Mega-Stat outcome. - The conclusion is the summary of all the questions. Analyze the Case Study Project by answering the following questions 1. For the quantitative variable (Salary): a) Find stem and leave display the stem and leave to determine the shape of the data b) Find boxplot and use the boxplot to determine the shape of the data, and if there is outlier c) Find mean, variance, standard deviation, mode, and coefficient of variation. d) Find the five-summary measures, e) Use the relation between mean, median, mode to determine the shape of the data 1. For each of the 2 qualitative variables (Position and Experience) a) Find frequency table with relative frequencies, and use it to describe the descript the percentage or tne categories for each variable b) Find bar chart 2. Is the mean annual salary for salespersons different from 20000 AED? Use a 0.05 level of significance. Test the hypotheses using both p value and test statistic 3. Is there any significant difference of the mean salary due to position? Use a 0.05 level of significance 4. Is there any significant difference of the mean salary due to years of experience? Use a 0.05 level of significance. 5. Use the following contingency table answer the question: Is the salesperson position depend on the salesperson experience? Use a 0.05 level of significance. 6. Write your conclusions
 Step by Step Solution
There are 3 Steps involved in it
Step: 1

Get Instant Access to Expert-Tailored Solutions
See step-by-step solutions with expert insights and AI powered tools for academic success
Step: 2

Step: 3

Ace Your Homework with AI
Get the answers you need in no time with our AI-driven, step-by-step assistance
Get Started


