Answered step by step
Verified Expert Solution
Question
1 Approved Answer
a) Look at the data and see if you can identify any trend? Use Excel to plot a time series plot. Remember to format


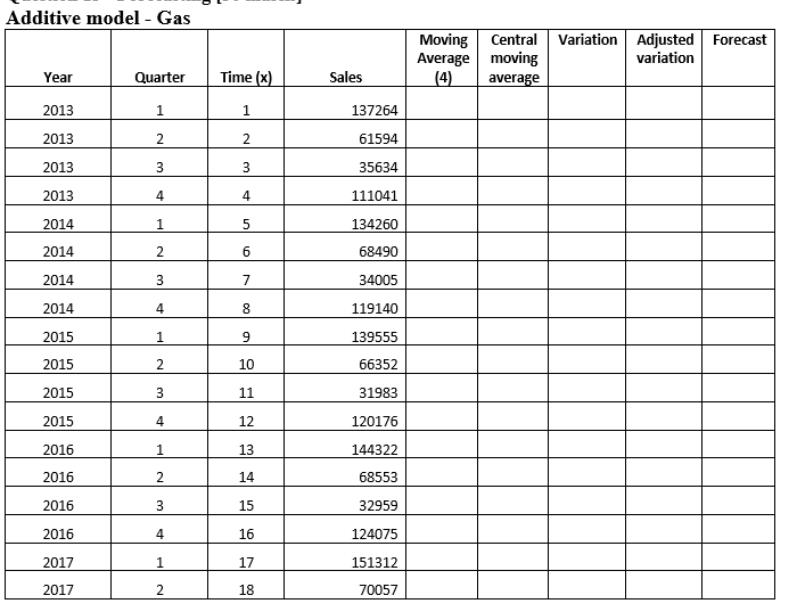
a) Look at the data and see if you can identify any trend? Use Excel to plot a time series plot. Remember to format the following: Title; X and Y-axis labels; Adjust the scale of the Y-axis. b) Calculate the Centered Moving Average (CMA)/Baseline. Interpret it. c) Calculate the Trend and interpret the trend. d) Determine the Seasonality (St) and interpret it properly. e) Forecast the revenue for in Q3 and 04 in 2017. Additive model - Gas Year 2013 2013 2013 2013 2014 2014 2014 2014 2015 2015 2015 2015 2016 2016 2016 2016 2017 2017 Quarter 1 2 3 4 1 2 3 4 1 2 3 4 1 2 3 4 1 2 Time (x) 1 2 3 4 5 16 7 8 9 10 11 12 13 14 15 16 17 18 Sales 137264 61594 35634 111041 134260 68490 34005 119140 139555 66352 31983 120176 144322 68553 32959 124075 151312 70057 Moving Central Variation Adjusted Forecast Average moving variation average
Step by Step Solution
There are 3 Steps involved in it
Step: 1

Get Instant Access to Expert-Tailored Solutions
See step-by-step solutions with expert insights and AI powered tools for academic success
Step: 2

Step: 3

Ace Your Homework with AI
Get the answers you need in no time with our AI-driven, step-by-step assistance
Get Started


