

Question
a) make an estimation of average rate of change of stock over the 6 years (need steps of calculations) b) draw a density function of
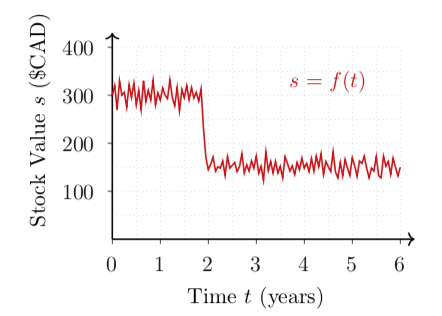
a) make an estimation of average rate of change of stock over the 6 years (need steps of calculations)
b) draw a density function of the stock values (in the 6 years)
c) Draw a cumulative distribution function of the stock values (in the 6 years)
400 s = f(t) 300 wwwww Stock Value s ($CAD) 200 kynhnghimmwwwwwaan 100 0 1 5 6 2 3 4 Time t (years) 400 s = f(t) 300 wwwww Stock Value s ($CAD) 200 kynhnghimmwwwwwaan 100 0 1 5 6 2 3 4 Time t (years)Step by Step Solution
There are 3 Steps involved in it
Step: 1

Get Instant Access to Expert-Tailored Solutions
See step-by-step solutions with expert insights and AI powered tools for academic success
Step: 2

Step: 3
Ace Your Homework with AI
Get the answers you need in no time with our AI-driven, step-by-step assistance
Get Started
Personal Finance For People In Addiction Recovery
Authors: Brandon Turner
1st Edition
1675917043, 978-1675917046