Answered step by step
Verified Expert Solution
Question
1 Approved Answer
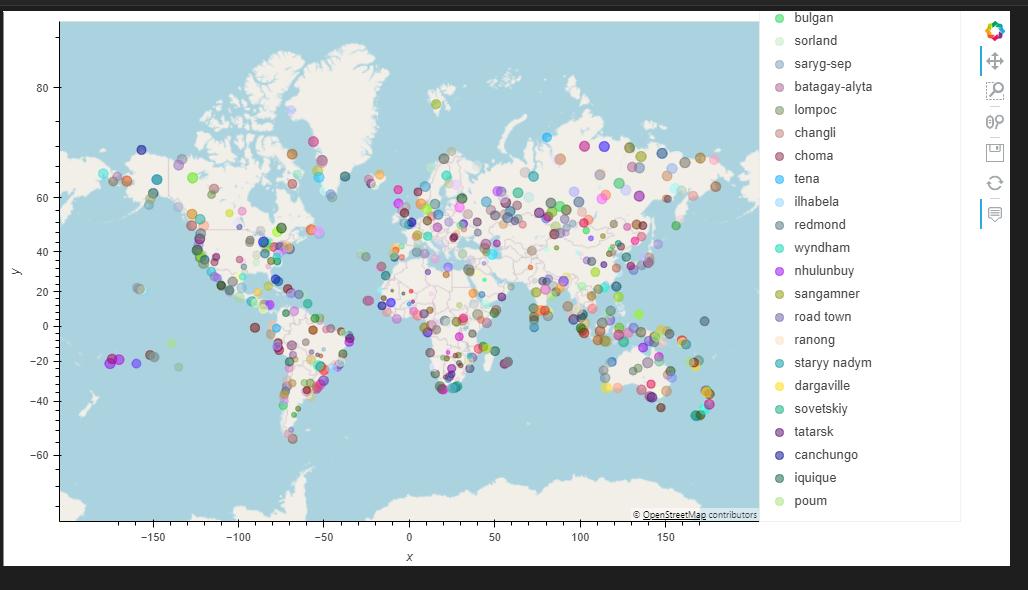
A map that displays a point for every city in the `city_data_df` DataFrame. The size of the point should be the humidity in each city.
A map that displays a point for every city in the `city_data_df` DataFrame. The size of the point should be the humidity in each city.
import hvplot.pandas
import pandas as pd
import requests
city_data_df = pd.read_csv("output_data/cities.csv")
city_data_df.head()

CSV file link: https://drive.google.com/drive/folders/1WyXbYnXxx830iNgupM_7fibJB-3-QElE?usp=sharing
A 80 60 40 20 0 -20 -40 -60 -150 -100 -50 X 50 100 OpenStreetMag contributors 150 bulgan sorland. saryg-sep batagay-alyta lompoc changli choma tena ilhabela redmond wyndham nhulunbuy sangamner road town ranong staryy nadym dargaville sovetskiy tatarsk canchungo iquique poum +++ 09 3 E
Step by Step Solution
★★★★★
3.58 Rating (155 Votes )
There are 3 Steps involved in it
Step: 1
The following code will generate a map that displays a point for every city in the citydata...
Get Instant Access to Expert-Tailored Solutions
See step-by-step solutions with expert insights and AI powered tools for academic success
Step: 2

Step: 3

Ace Your Homework with AI
Get the answers you need in no time with our AI-driven, step-by-step assistance
Get Started


