

Question
A marketing company based out of New York City is doing well and is looking to expand internationally. The CEO and VP of Operations decide
A marketing company based out of New York City is doing well and is looking to expand internationally. The CEO and VP of Operations decide to enlist the help of a consulting firm that you work for, to help collect data and analyze market trends.
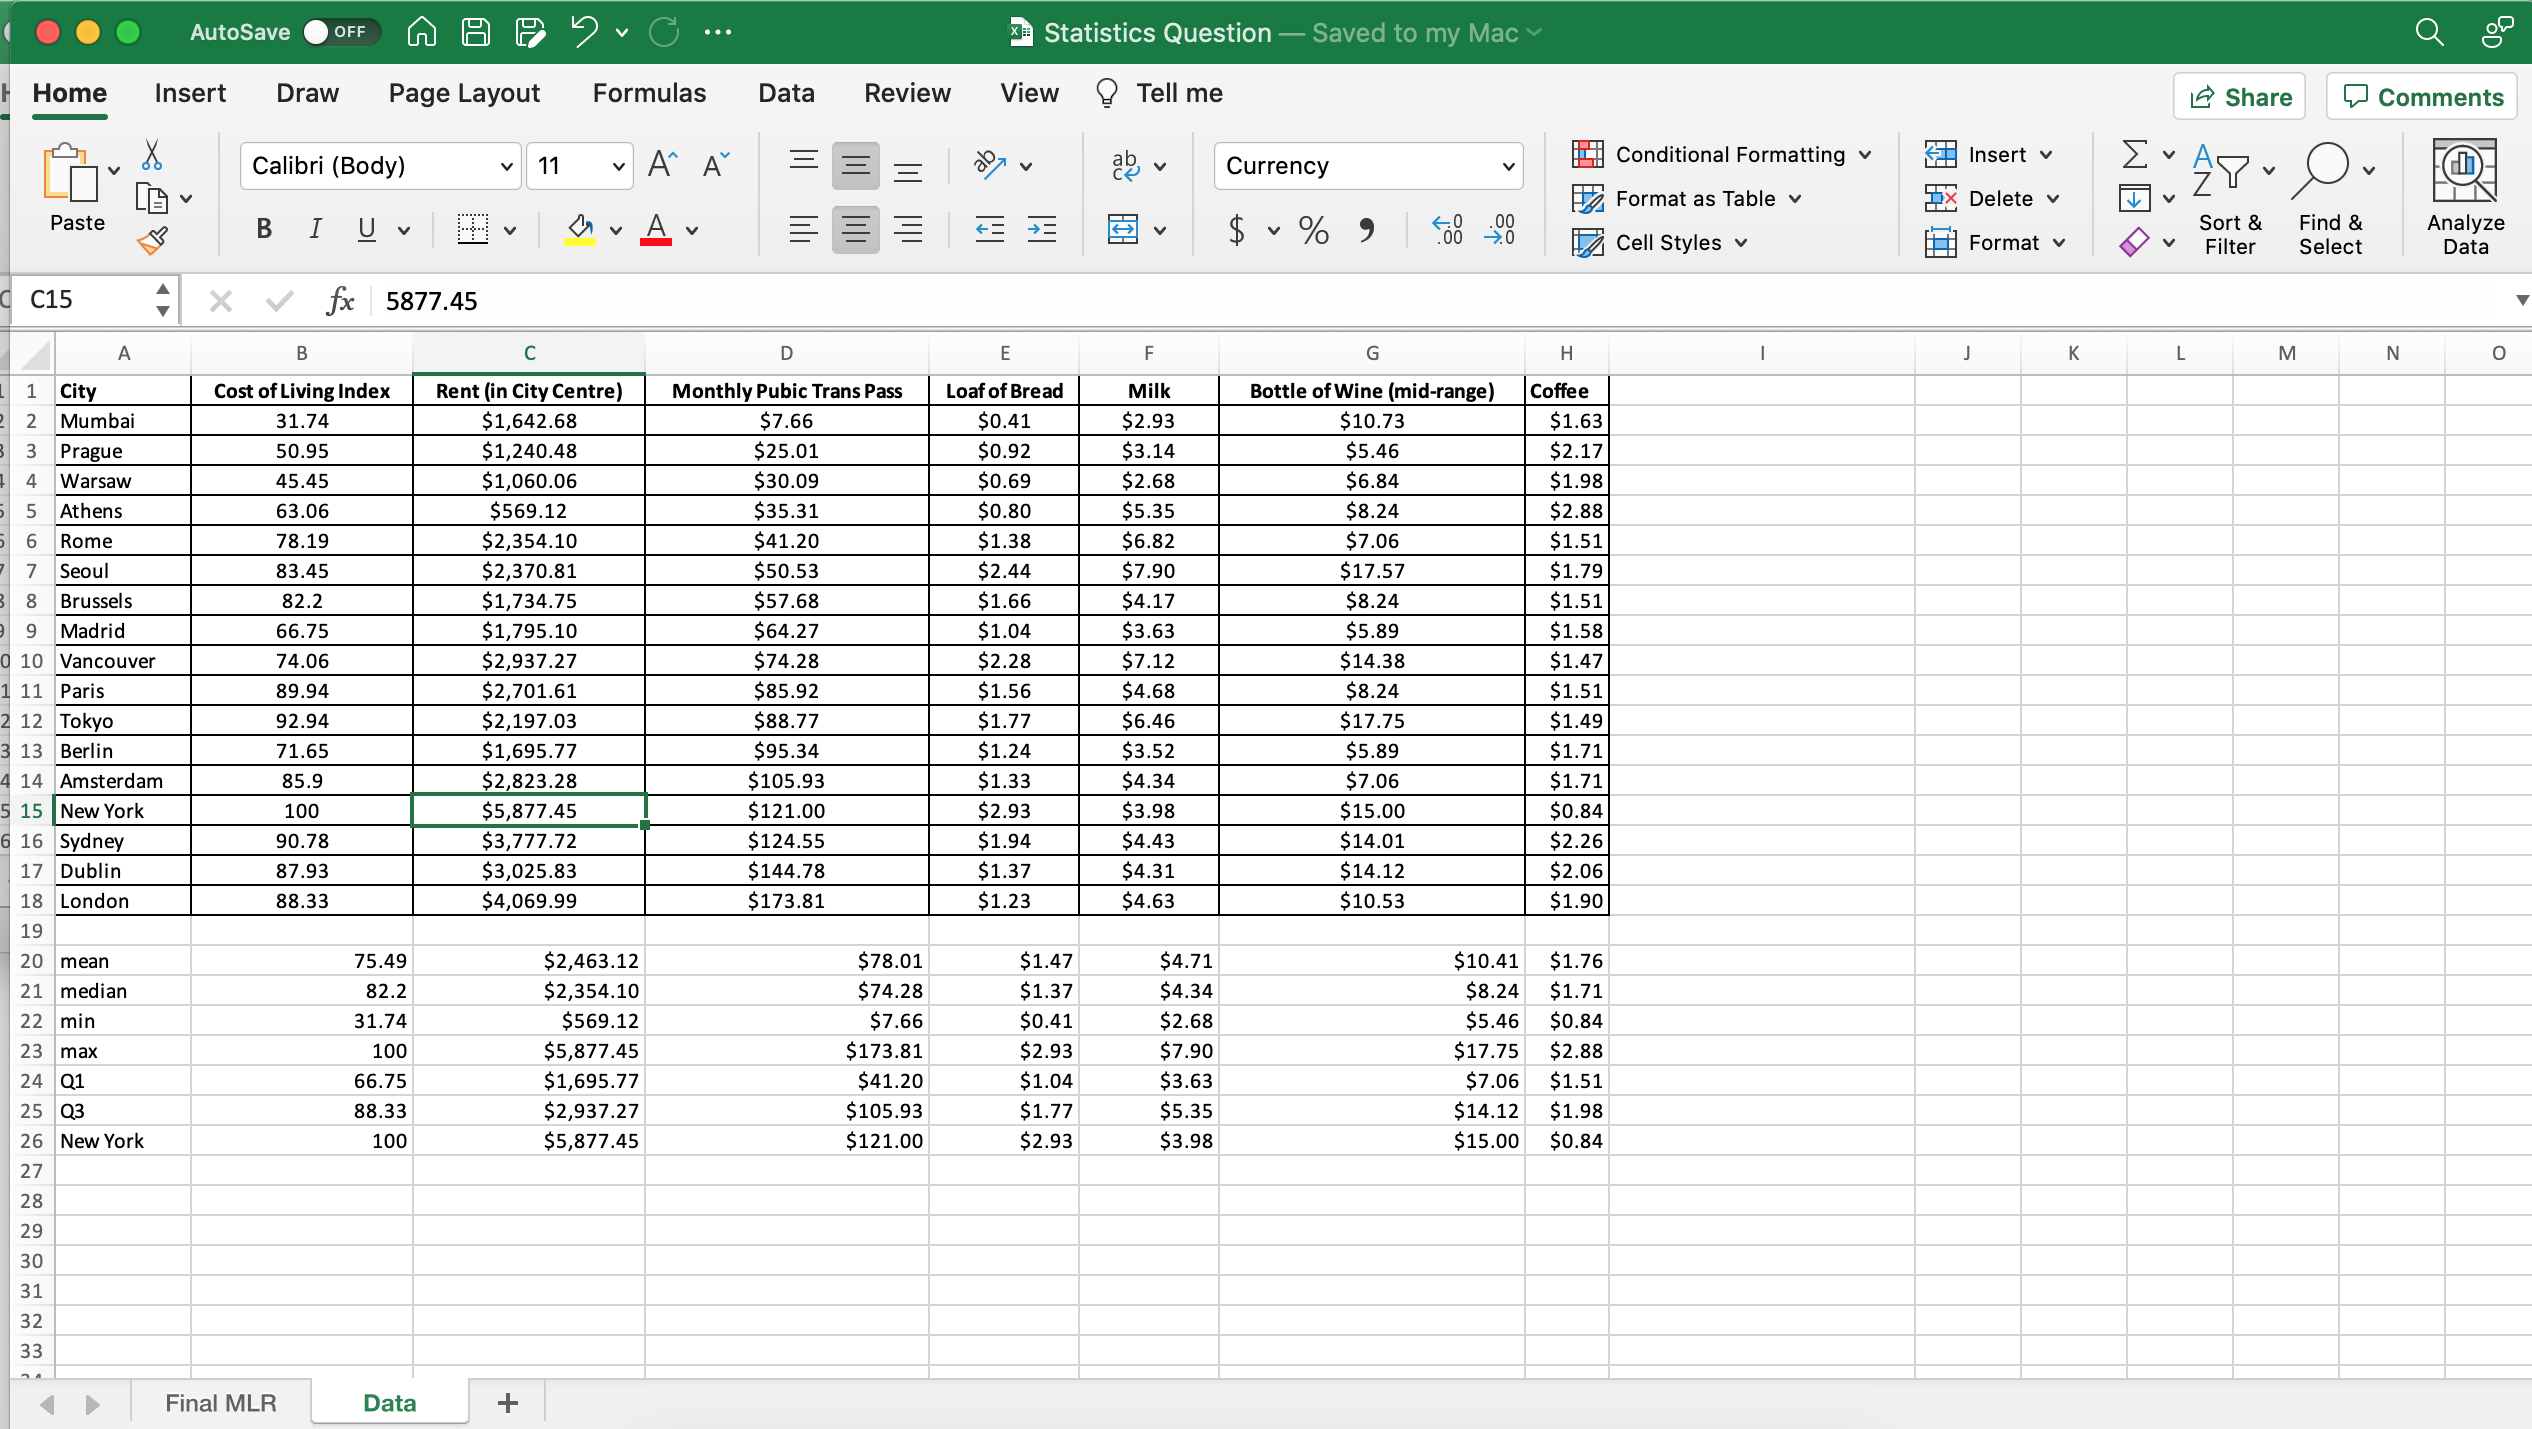
You work for Mercer Human Resources. TheMercer Human Resource Consulting websitelists prices of certain items in selected cities around the world. They also report an overall cost-of-living index for each city compared to the costs of hundreds of items in New York City (NYC). For example, London at 88.33 is 11.67% less expensive than NYC.
In the Excel document, you will find the 2018 data for 17 cities in the data set Cost of Living. Included are the 2018 cost of living index, cost of a 3-bedroom apartment (per month), price of monthly transportation pass, price of a mid-range bottle of wine, price of a loaf of bread (1 lb.), the price of a gallon of milk and price for a 12 oz. cup of black coffee. All prices are in U.S. dollars.
You use this information to run a Multiple Linear Regression to predict Cost of living, along with calculating various descriptive statistics. This is given in the Excel output (that is, the MLR has already been calculated. Your task is to interpret the data).
Based on this information, in which city should you open a second office in? You must justify your answer. If you want to recommend 2 or 3 different cities and rank them based on the data and your findings, this is fine as well.
Deliverable Requirements:
You do not need to do any calculations, but you do need to pick a city to open a second location at and justify your answer based upon the provided results of the Multiple Linear Regression.
Things to Consider:
To help you make this decision here are some things to consider:
- Based on the MLR output, what variable(s) is/are significant?
- From the significant predictors, review the mean, median, min, max, Q1 and Q3 values?
- It might be a good idea to compare these values to what the New York value is for that variable. Remember New York is the baseline as that is where headquarters are located.
- Based on the descriptive statistics, for the significant predictors, what city has the best potential?
- What city or cities fall are below the median?
- What city or cities are in the upper 3rdquartile?
Step by Step Solution
There are 3 Steps involved in it
Step: 1

Get Instant Access to Expert-Tailored Solutions
See step-by-step solutions with expert insights and AI powered tools for academic success
Step: 2

Step: 3
Ace Your Homework with AI
Get the answers you need in no time with our AI-driven, step-by-step assistance
Get Started
Elementary Algebra
Authors: Charles P McKeague
2nd Edition
1483263819, 9781483263816