Answered step by step
Verified Expert Solution
Question
1 Approved Answer
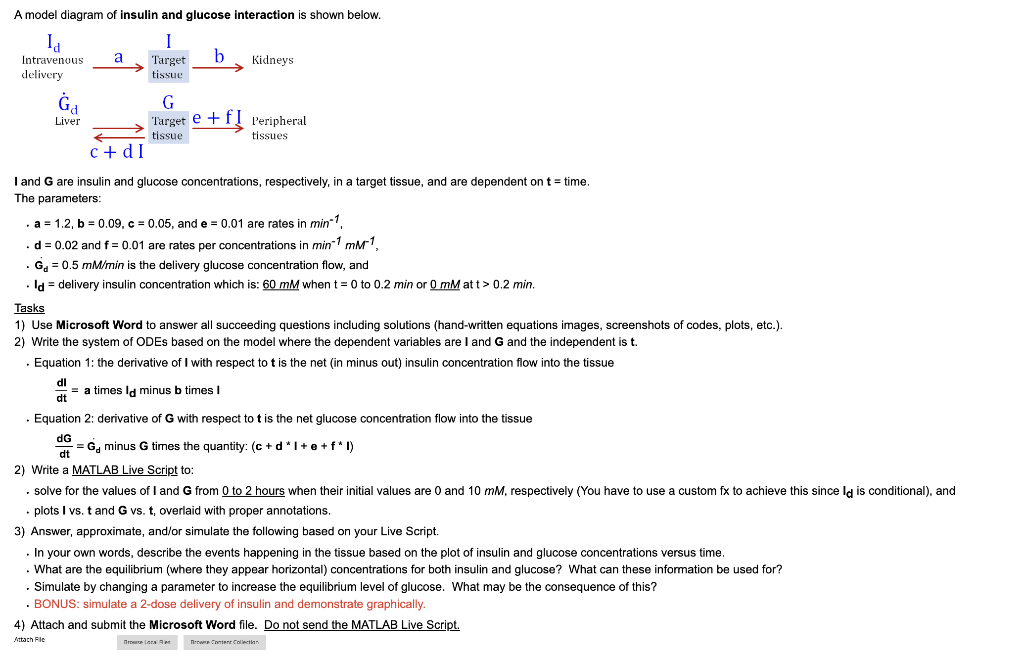
A model diagram of insulin and glucose interaction is shown below. I and G are insulin and glucose concentrations, respectively, in a target tissue, and
Step by Step Solution
There are 3 Steps involved in it
Step: 1

Get Instant Access to Expert-Tailored Solutions
See step-by-step solutions with expert insights and AI powered tools for academic success
Step: 2

Step: 3
Ace Your Homework with AI
Get the answers you need in no time with our AI-driven, step-by-step assistance
Get Started