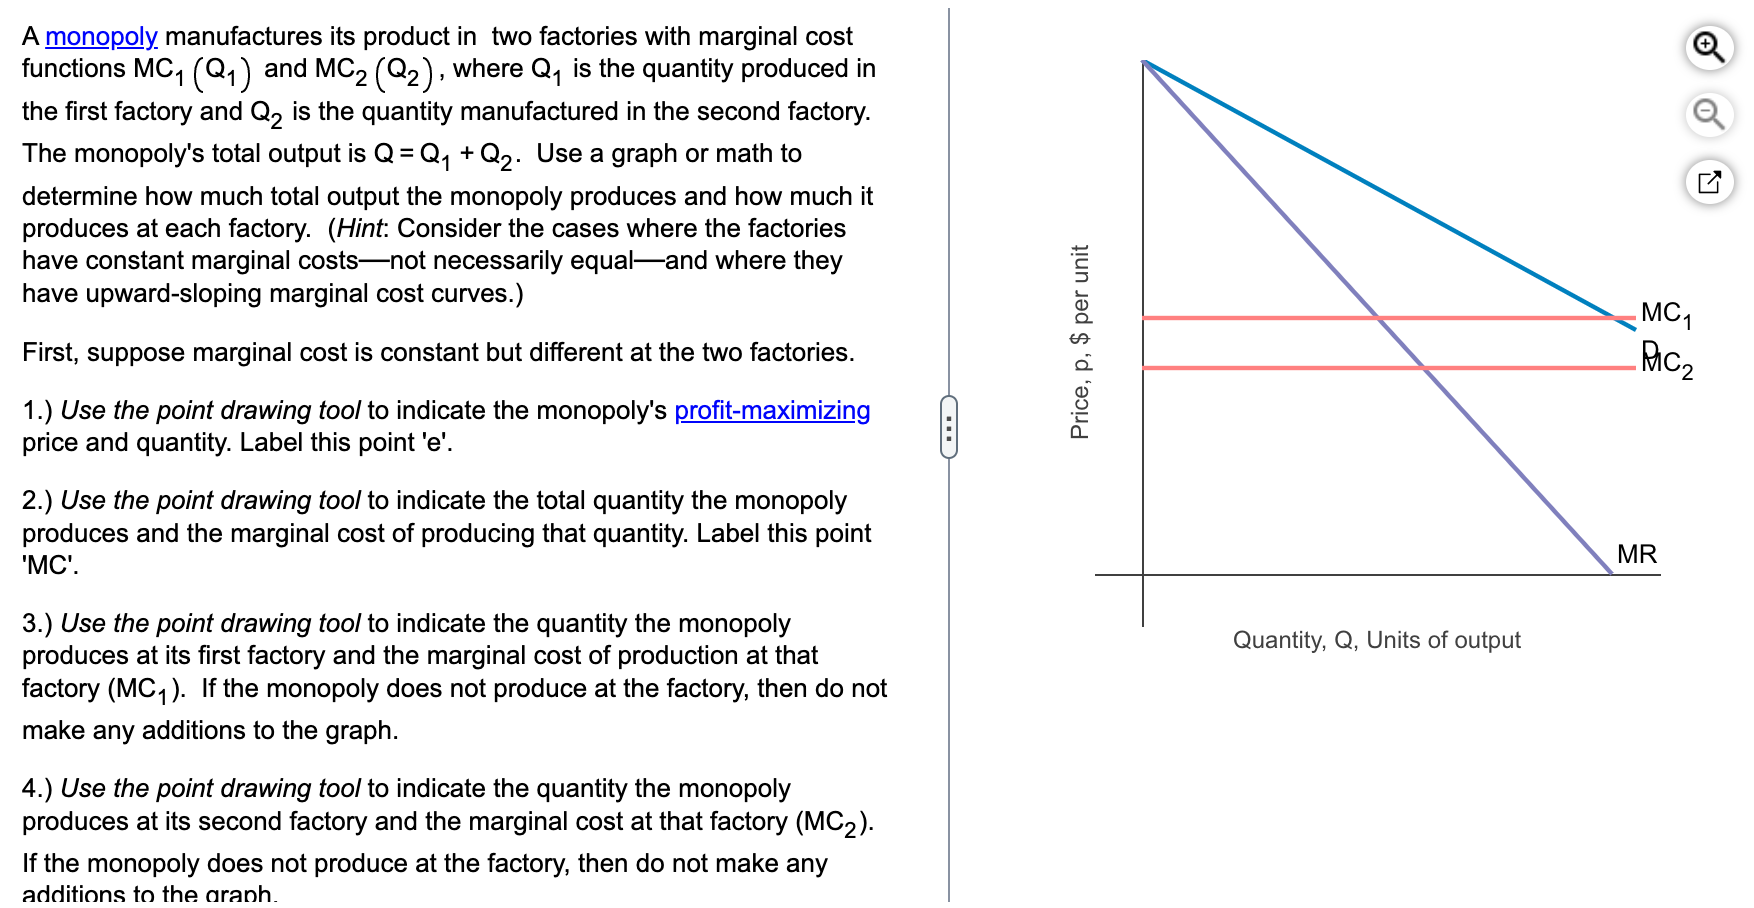
A monopoly manufactures its product in two factories with marginal cost functions M1(Q1) and MC2(Q2), where Q1 is the quantity produced in the first factory and Q2 is the quantity manufactured in the second factory. The monopoly's total output is Q=Q1+Q2. Use a graph or math to determine how much total output the monopoly produces and how much it produces at each factory. (Hint: Consider the cases where the factories have constant marginal costs-not necessarily equal-and where they have upward-sloping marginal cost curves.) First, suppose marginal cost is constant but different at the two factories. 1.) Use the point drawing tool to indicate the monopoly's profit-maximizing price and quantity. Label this point 'e'. 2.) Use the point drawing tool to indicate the total quantity the monopoly produces and the marginal cost of producing that quantity. Label this point 'MC'. 3.) Use the point drawing tool to indicate the quantity the monopoly produces at its first factory and the marginal cost of production at that factory (MC1). If the monopoly does not produce at the factory, then do not make any additions to the graph. 4.) Use the point drawing tool to indicate the quantity the monopoly produces at its second factory and the marginal cost at that factory (MC2). If the monopoly does not produce at the factory, then do not make any additions to the aranh. A monopoly manufactures its product in two factories with marginal cost functions M1(Q1) and MC2(Q2), where Q1 is the quantity produced in the first factory and Q2 is the quantity manufactured in the second factory. The monopoly's total output is Q=Q1+Q2. Use a graph or math to determine how much total output the monopoly produces and how much it produces at each factory. (Hint: Consider the cases where the factories have constant marginal costs-not necessarily equal-and where they have upward-sloping marginal cost curves.) First, suppose marginal cost is constant but different at the two factories. 1.) Use the point drawing tool to indicate the monopoly's profit-maximizing price and quantity. Label this point 'e'. 2.) Use the point drawing tool to indicate the total quantity the monopoly produces and the marginal cost of producing that quantity. Label this point 'MC'. 3.) Use the point drawing tool to indicate the quantity the monopoly produces at its first factory and the marginal cost of production at that factory (MC1). If the monopoly does not produce at the factory, then do not make any additions to the graph. 4.) Use the point drawing tool to indicate the quantity the monopoly produces at its second factory and the marginal cost at that factory (MC2). If the monopoly does not produce at the factory, then do not make any additions to the aranh