Question: A MOSFET (Metal-Oxide-Semiconductor Field-Effect Transistor) is an active electronic component that can be used either as a digital switch or as an amplifier. 10


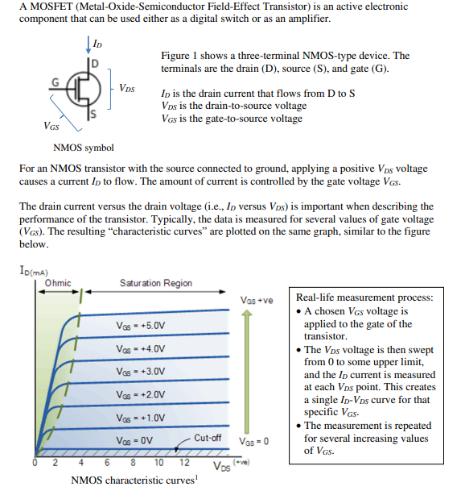
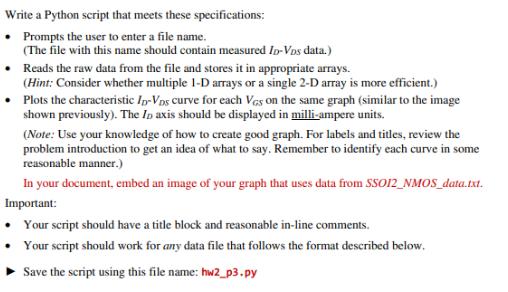
A MOSFET (Metal-Oxide-Semiconductor Field-Effect Transistor) is an active electronic component that can be used either as a digital switch or as an amplifier. 10 VGS VDs Ohmic Figure I shows a three-terminal NMOS-type device. The terminals are the drain (D), source (S), and gate (G). NMOS symbol For an NMOS transistor with the source connected to ground, applying a positive Vos voltage causes a current lo to flow. The amount of current is controlled by the gate voltage Vos. In is the drain current that flows from D to S Vos is the drain-to-source voltage Vos is the gate-to-source voltage The drain current versus the drain voltage (i.e.. In versus Vos) is important when describing the performance of the transistor. Typically, the data is measured for several values of gate voltage (VGs). The resulting "characteristic curves" are plotted on the same graph, similar to the figure below. ID(ma) 6 Saturation Region Vas - +5.0V Vas - +4.0V Vas - +3.0V Vas- +2.0V Vas +1.0V Voc -OV Cut-off 8 10 12 NMOS characteristic curves' Vas+ve Vas-0 Real-life measurement process: A chosen Vos voltage is applied to the gate of the transistor. The Vos voltage is then swept from 0 to some upper limit, and the ID current is measured at each Vns point. This creates a single In-Vos curve for that specific Vas- The measurement is repeated for several increasing values of Vas. Write a Python script that meets these specifications: Prompts the user to enter a file name. (The file with this name should contain measured ID-Vos data.) Reads the raw data from the file and stores it in appropriate arrays. (Hint: Consider whether multiple 1-D arrays or a single 2-D array is more efficient.) Plots the characteristic In-Vos curve for each VGs on the same graph (similar to the image shown previously). The In axis should be displayed in milli-ampere units. (Note: Use your knowledge of how to create good graph. For labels and titles, review the problem introduction to get an idea of what to say. Remember to identify each curve in some reasonable manner.) In your document, embed an image of your graph that uses data from SSO12_NMOS_data.txt. Important: Your script should have a title block and reasonable in-line comments. Your script should work for any data file that follows the format described below. Save the script using this file name: hw2_p3.py
Step by Step Solution
3.43 Rating (153 Votes )
There are 3 Steps involved in it
Based on the file format you pr... View full answer

Get step-by-step solutions from verified subject matter experts


