Question
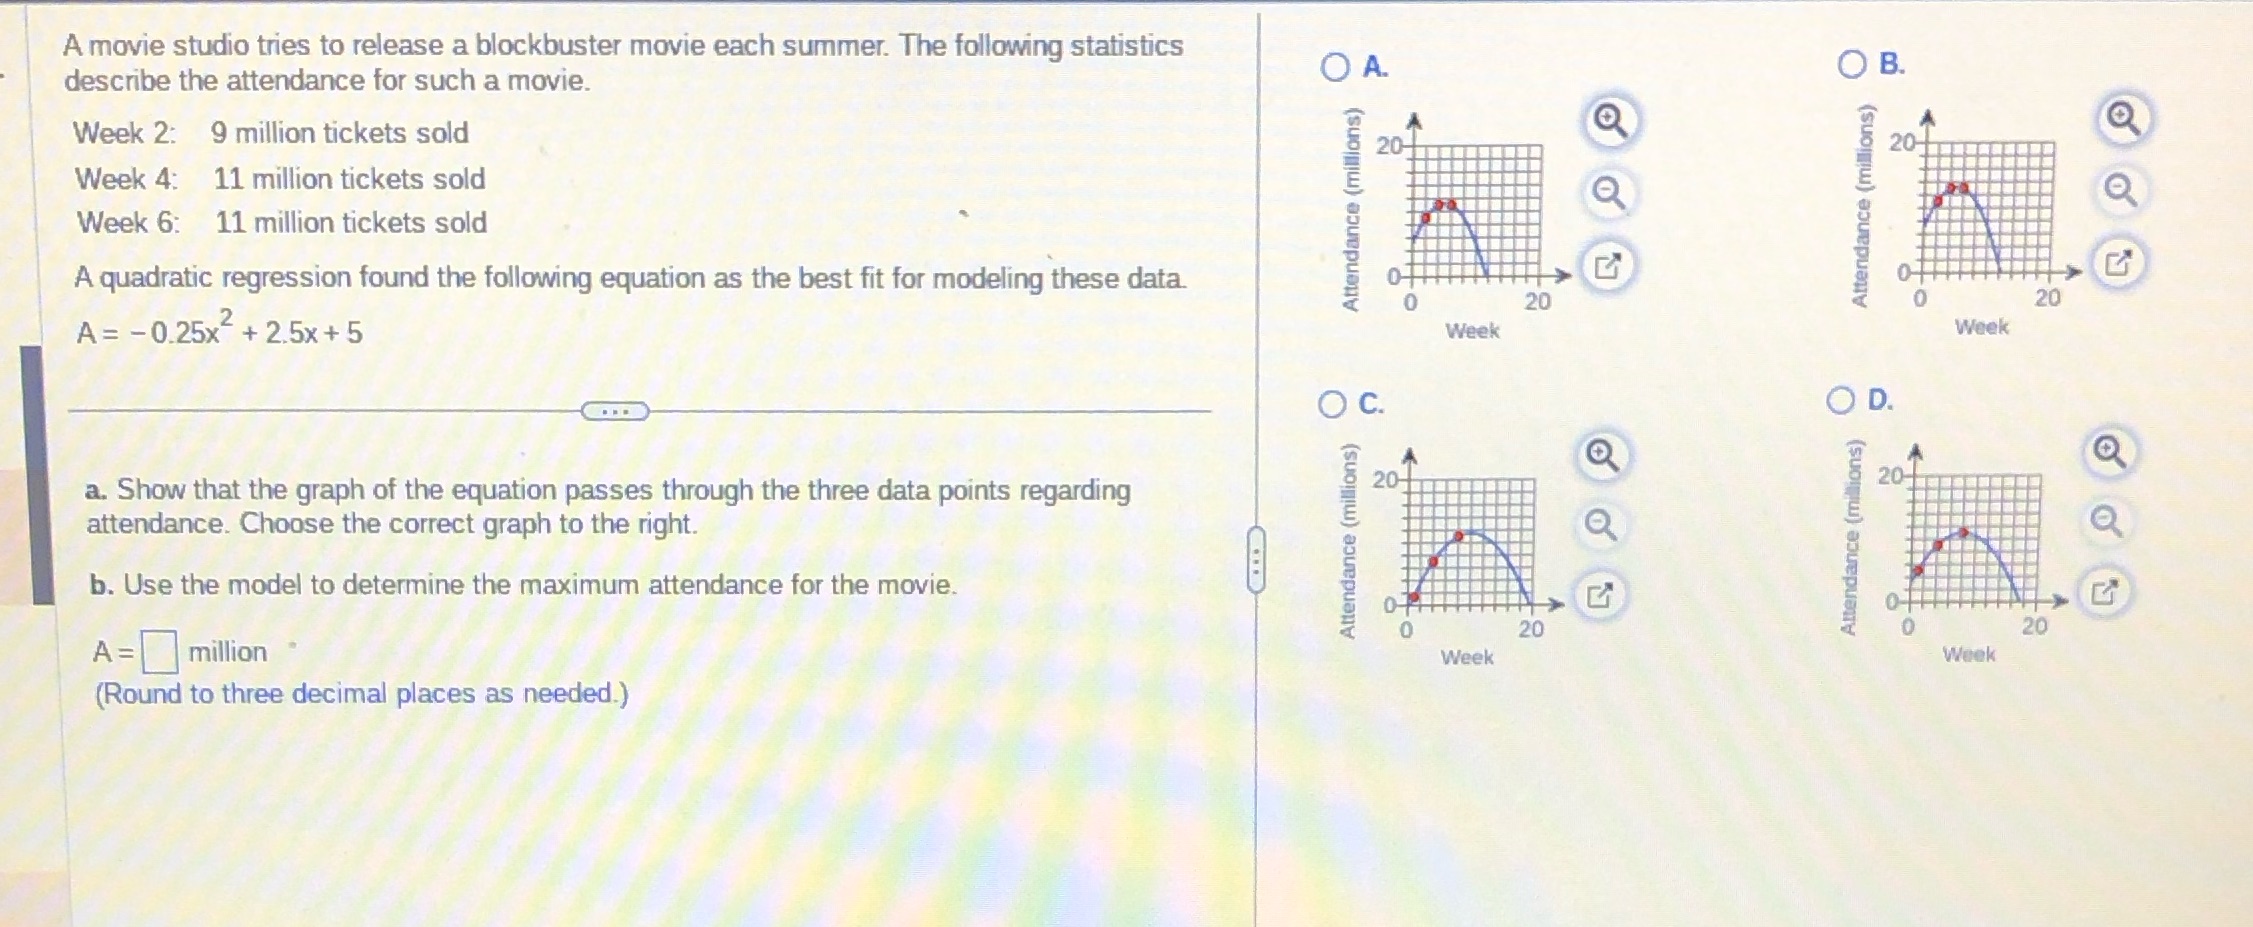
A movie studio tries to release a blockbuster movie each summer. The following statistics describe the attendance for such a movie. Week 2: 9

A movie studio tries to release a blockbuster movie each summer. The following statistics describe the attendance for such a movie. Week 2: 9 million tickets sold Week 4: 11 million tickets sold Week 6: 11 million tickets sold A quadratic regression found the following equation as the best fit for modeling these data. A = -0.25x + 2.5x+5 a. Show that the graph of the equation passes through the three data points regarding attendance. Choose the correct graph to the right. b. Use the model to determine the maximum attendance for the movie. A = million (Round to three decimal places as needed.) A. Attendance (millions) C. Attendance (millions) 20- 20- 0 20 Week 0 Week 20 20 G 0 Attendance (millions) O B. 20+ Attendance (millions) D. 20- Week 20 G Week 20 Q
Step by Step Solution
There are 3 Steps involved in it
Step: 1

Get Instant Access to Expert-Tailored Solutions
See step-by-step solutions with expert insights and AI powered tools for academic success
Step: 2

Step: 3

Ace Your Homework with AI
Get the answers you need in no time with our AI-driven, step-by-step assistance
Get StartedRecommended Textbook for
Introduction to Operations Research
Authors: Frederick S. Hillier, Gerald J. Lieberman
10th edition
978-0072535105, 72535105, 978-1259162985
Students also viewed these Mathematics questions
Question
Answered: 1 week ago
Question
Answered: 1 week ago
Question
Answered: 1 week ago
Question
Answered: 1 week ago
Question
Answered: 1 week ago
Question
Answered: 1 week ago
Question
Answered: 1 week ago
Question
Answered: 1 week ago
Question
Answered: 1 week ago
Question
Answered: 1 week ago
Question
Answered: 1 week ago
Question
Answered: 1 week ago
Question
Answered: 1 week ago
Question
Answered: 1 week ago
Question
Answered: 1 week ago
Question
Answered: 1 week ago
Question
Answered: 1 week ago
Question
Answered: 1 week ago
Question
Answered: 1 week ago
Question
Answered: 1 week ago
Question
Answered: 1 week ago
Question
Answered: 1 week ago
View Answer in SolutionInn App


