

Answered step by step
Verified Expert Solution
Question
1 Approved Answer
A newspaper article claimed that the afternoon hours were the worst in terms of robberies and provided the graph to the right in support
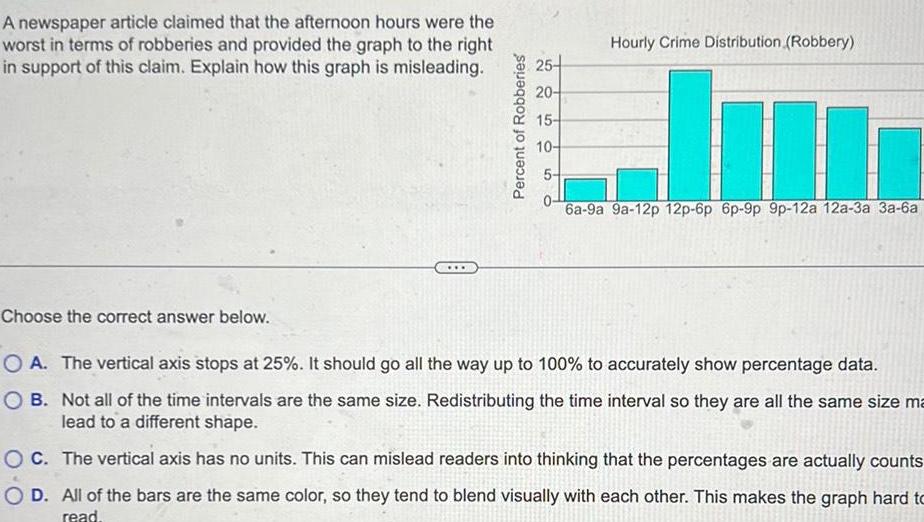
A newspaper article claimed that the afternoon hours were the worst in terms of robberies and provided the graph to the right in support of this claim. Explain how this graph is misleading. Percent of Robberies 25- 20- Hourly Crime Distribution (Robbery) 15- 10- 5- 6a-9a 9a-12p 12p-6p 6p-9p 9p-12a 12a-3a 3a-6a Choose the correct answer below. OA. The vertical axis stops at 25%. It should go all the way up to 100% to accurately show percentage data. OB. Not all of the time intervals are the same size. Redistributing the time interval so they are all the same size m lead to a different shape. OC. The vertical axis has no units. This can mislead readers into thinking that the percentages are actually counts D. All of the bars are the same color, so they tend to blend visually with each other. This makes the graph hard to read.
Step by Step Solution
There are 3 Steps involved in it
Step: 1

Get Instant Access to Expert-Tailored Solutions
See step-by-step solutions with expert insights and AI powered tools for academic success
Step: 2

Step: 3
Ace Your Homework with AI
Get the answers you need in no time with our AI-driven, step-by-step assistance
Get Started
Advanced Engineering Mathematics
Authors: Erwin Kreyszig
4th Edition
471021407, 9780471021407