

Answered step by step
Verified Expert Solution
Question
1 Approved Answer
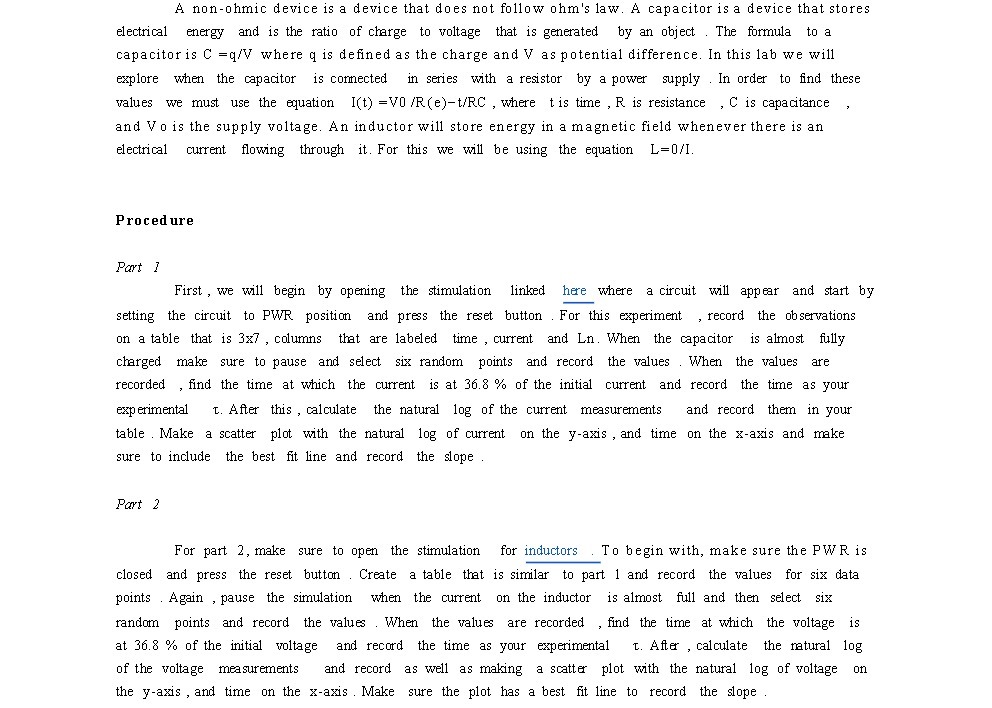
A non-ohmic device is a device that does not follow ohm's law. A capacitor is a device that stores electrical energy and is the ratio
Step by Step Solution
There are 3 Steps involved in it
Step: 1

Get Instant Access to Expert-Tailored Solutions
See step-by-step solutions with expert insights and AI powered tools for academic success
Step: 2

Step: 3
Ace Your Homework with AI
Get the answers you need in no time with our AI-driven, step-by-step assistance
Get Started
Introduction to Electrodynamics
Authors: David J. Griffiths
3rd Edition
978-0138053260, 013805326X, 8120316010, 978-8120316010