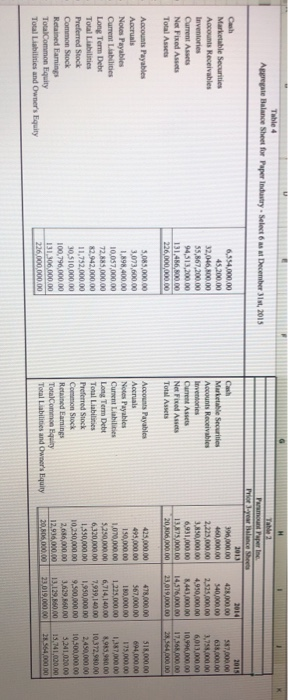
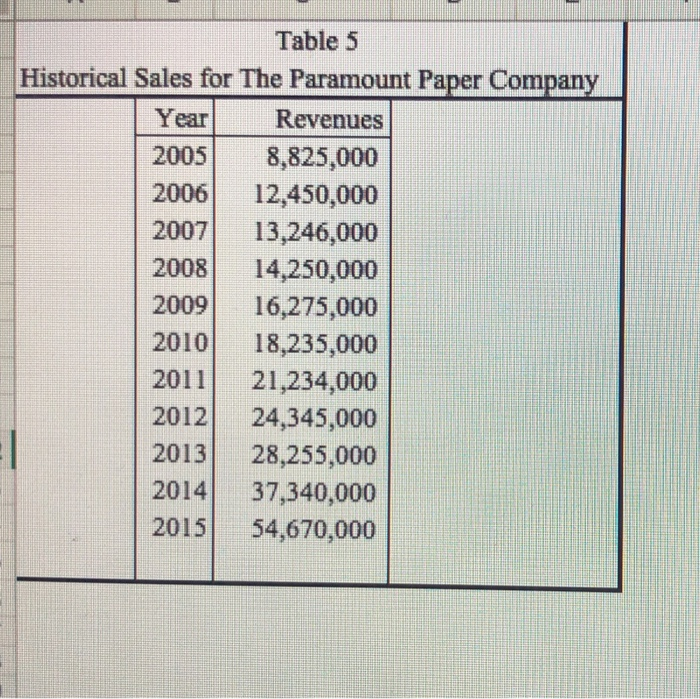
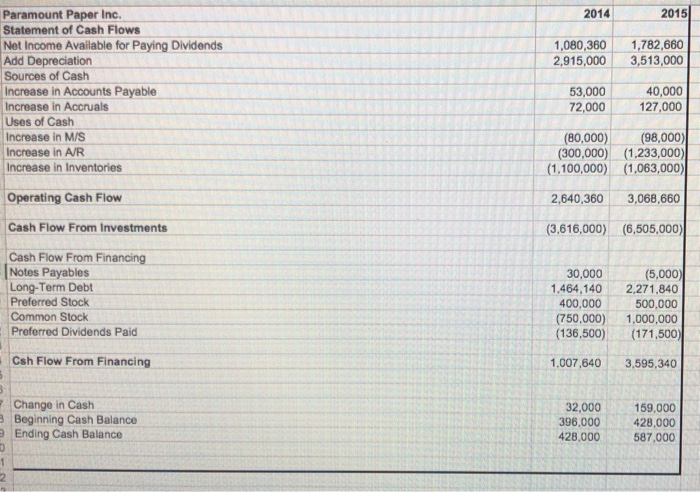
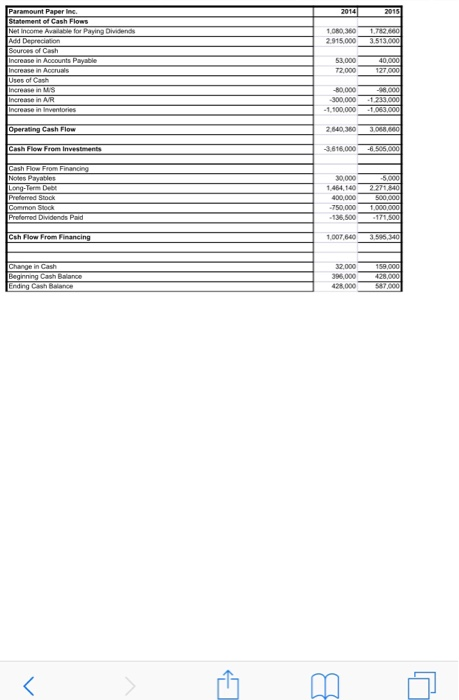
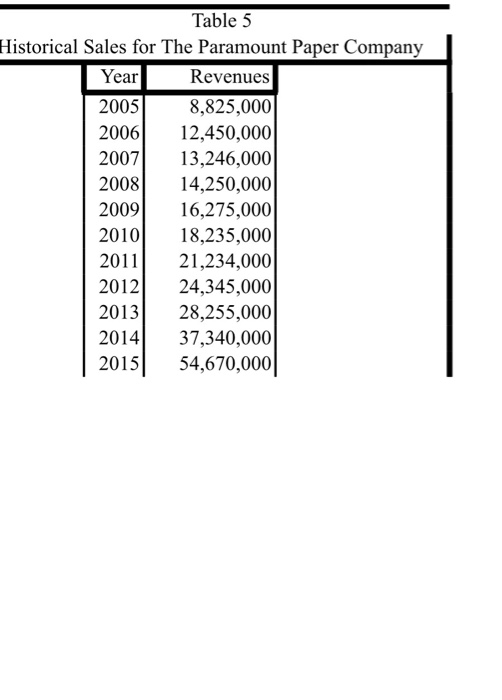
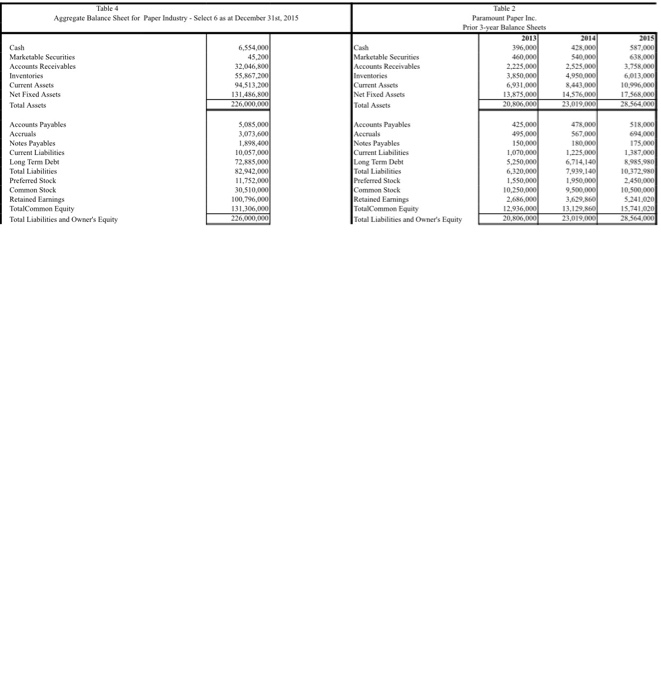
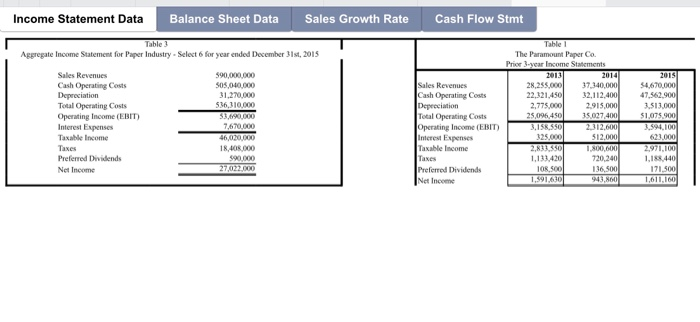
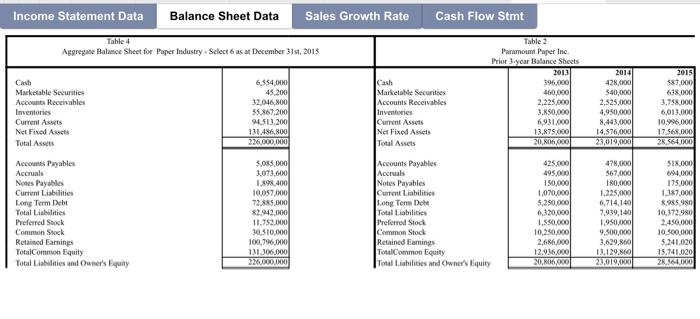
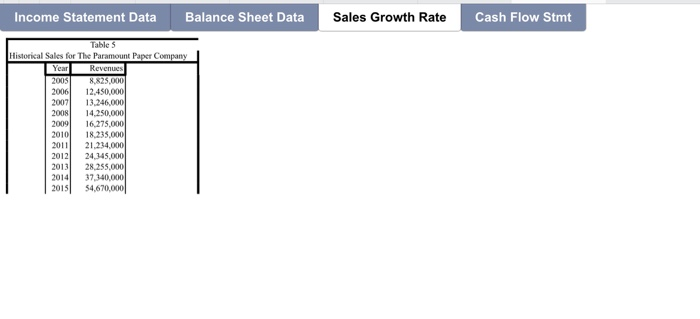
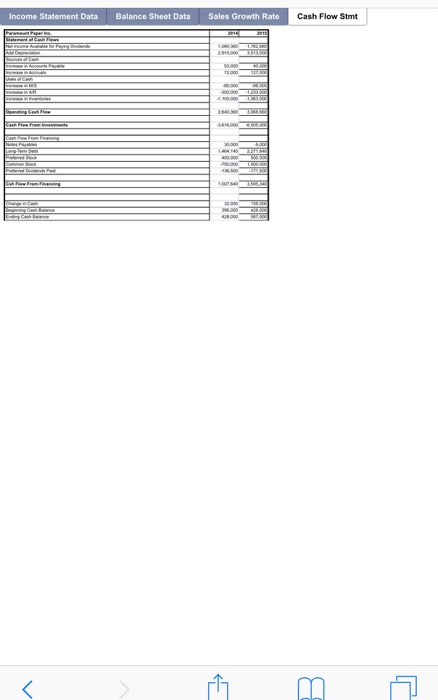
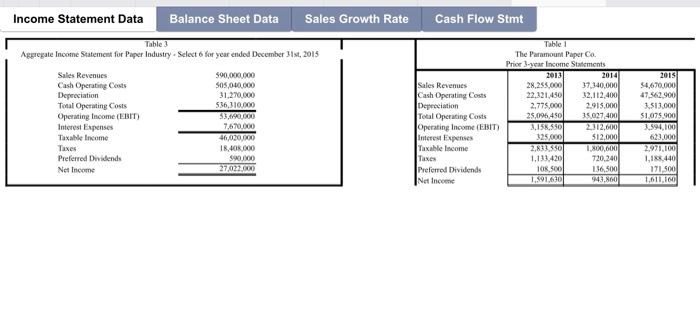
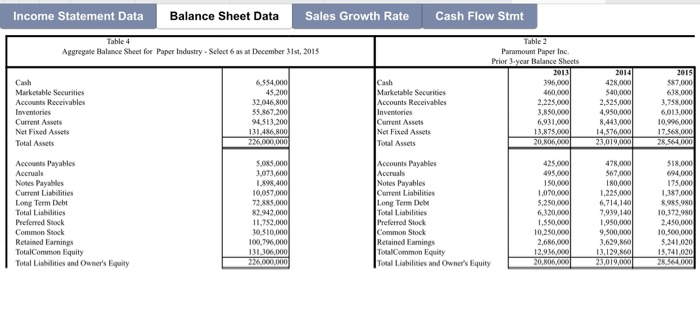
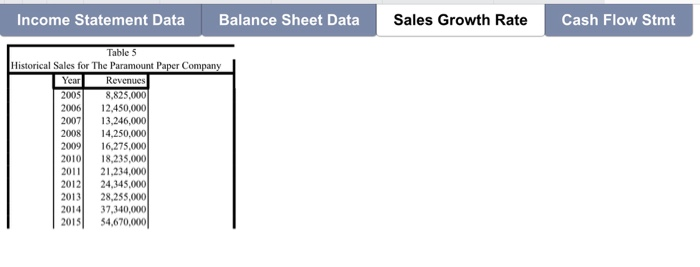
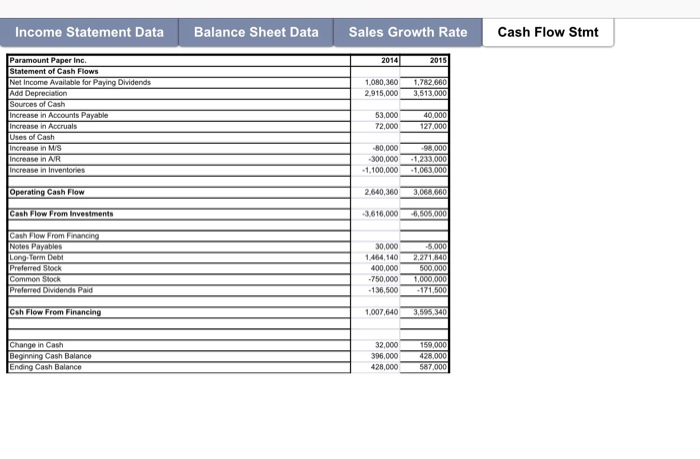
A p Table le Income Statement for Paper Industry. Select 6 for your ended December 2015 Table 1 The Parent Paper Co. Sales Revenues Cash Operating costs Depreciation Total Operating Costs Operating Income (EBIT) Interest Expenses Taxable income 390,000,000 505.040,000 31,270,000 56310.000 53,690,000 37,140,000 32,112,400 2,915.000 54,670,000 47,362,200 Sales Reves Cash Operating costs Depreciation Total Operating costs Operating Income (EBIT) Interest Expenses Taxable income 28.255.000 22,321.450 2,775.000 25,096,450 3,155,550 46,020,000 18,408,000 390.000 Preferred Dividends Net Income 2,833,330 1,133,420 1,185,40 Preferred Dwvidends Netlacome TORS 1.591.030 1.611160 Table 5 Historical Sales for The Paramount Paper Company | Year Revenues 2005 8,825,000 2006 12,450,000 2007 13,246,000 2008 14,250,000 2009 16,275,000 2010) 18,235,000 2011 21,234,000 2012 24,345,000 2013 28,255,000 2014 37,340,000 | 2015 54,670,000 A p Table le Income Statement for Paper Industry. Select 6 for your ended December 2015 Table 1 The Parent Paper Co. Sales Revenues Cash Operating costs Depreciation Total Operating Costs Operating Income (EBIT) Interest Expenses Taxable income 390,000,000 505.040,000 31,270,000 56310.000 53,690,000 37,140,000 32,112,400 2,915.000 54,670,000 47,362,200 Sales Reves Cash Operating costs Depreciation Total Operating costs Operating Income (EBIT) Interest Expenses Taxable income 28.255.000 22,321.450 2,775.000 25,096,450 3,155,550 46,020,000 18,408,000 390.000 Preferred Dividends Net Income 2,833,330 1,133,420 1,185,40 Preferred Dwvidends Netlacome TORS 1.591.030 1.611160 Table 5 Historical Sales for The Paramount Paper Company | Year Revenues 2005 8,825,000 2006 12,450,000 2007 13,246,000 2008 14,250,000 2009 16,275,000 2010) 18,235,000 2011 21,234,000 2012 24,345,000 2013 28,255,000 2014 37,340,000 | 2015 54,670,000