Answered step by step
Verified Expert Solution
Link Copied!

Question

1 Approved Answer

A park ranger is studying the age and health of Black Cherry Trees in his park. Part of his study displayed the histogram below. Heights
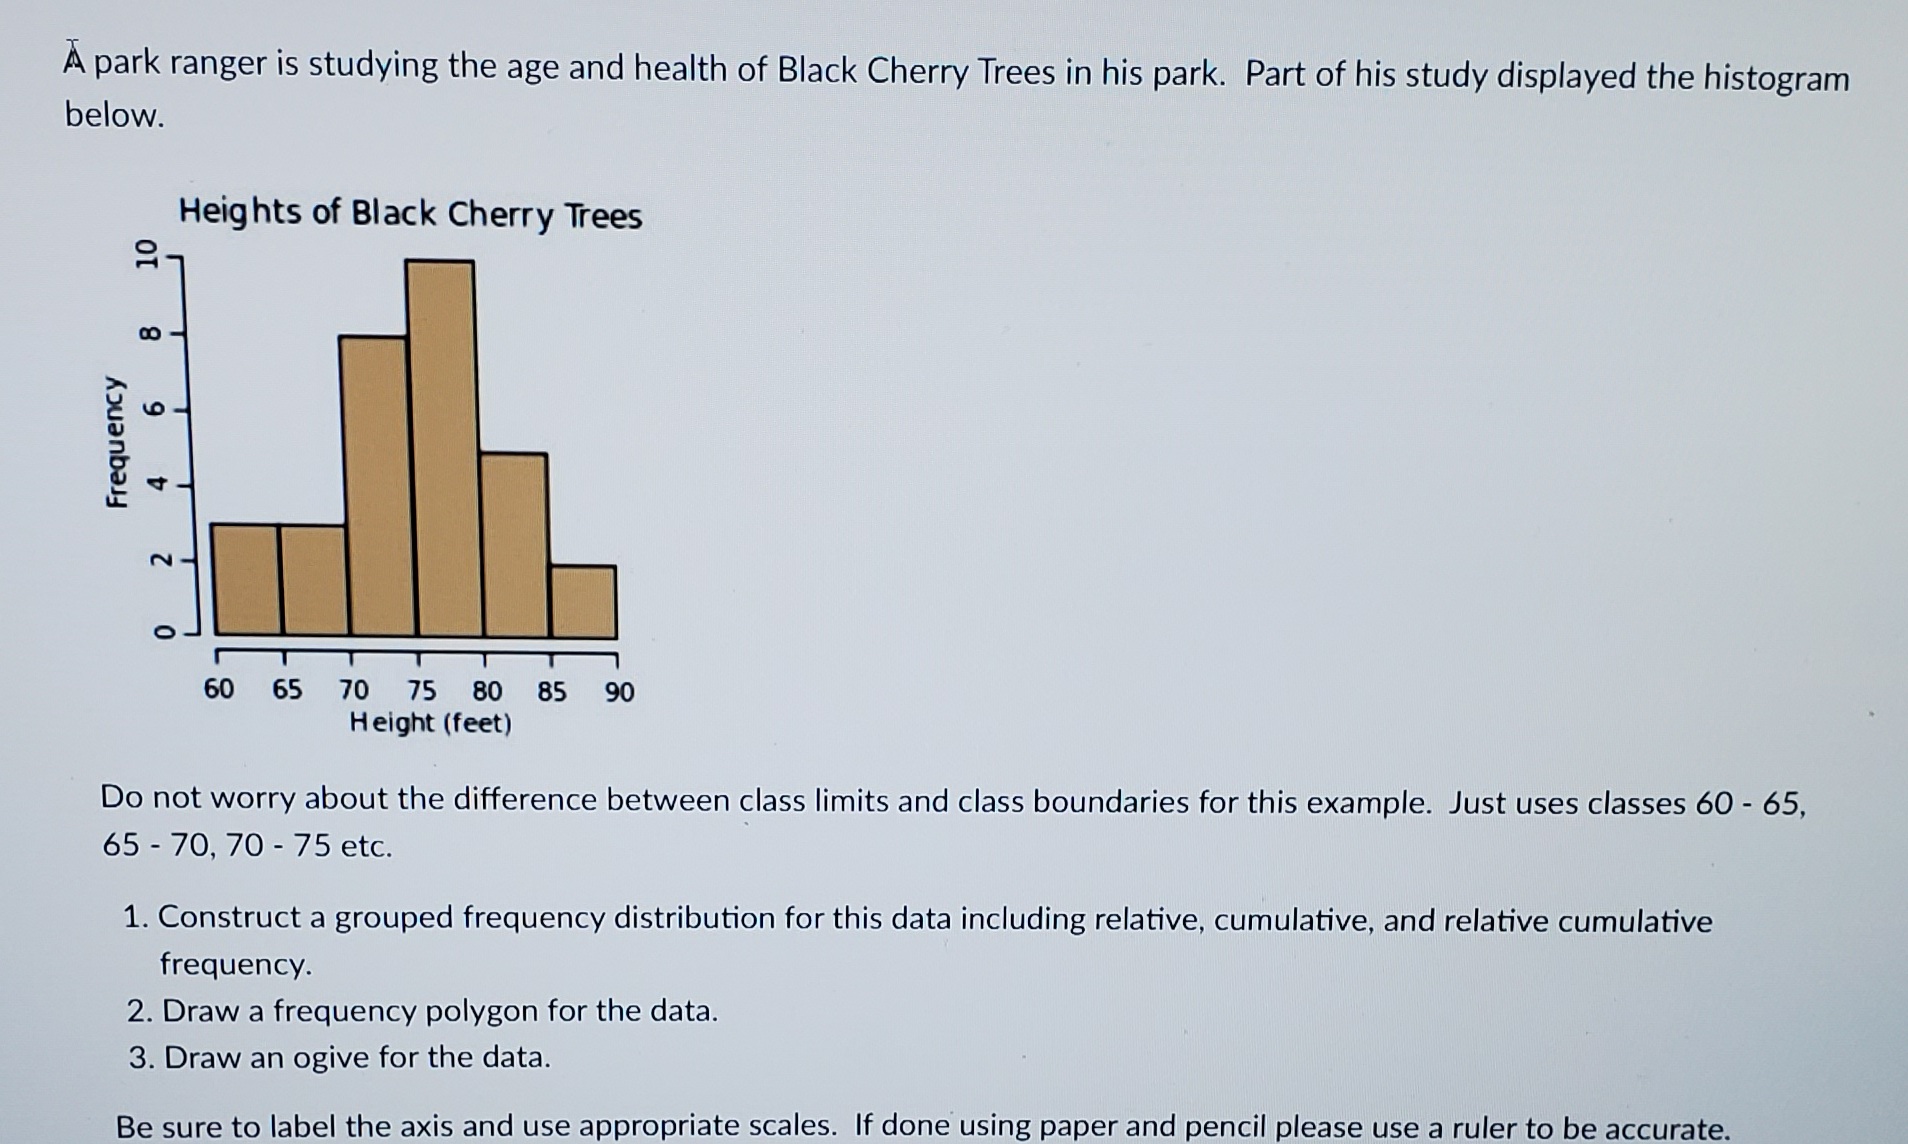
image text in transcribed
A park ranger is studying the age and health of Black Cherry Trees in his park. Part of his study displayed the histogram below. Heights of Black Cherry Trees 10 co - Frequency 60 65 70 75 80 85 9 Height (feet) Do not worry about the difference between class limits and class boundaries for this example. Just uses classes 60 - 65, 65 - 70, 70 - 75 etc. 1. Construct a grouped frequency distribution for this data including relative, cumulative, and relative cumulative frequency. 2. Draw a frequency polygon for the data. 3. Draw an ogive for the data. Be sure to label the axis and use appropriate scales. If done using paper and pencil please use a ruler to be accurate

Step by Step Solution

There are 3 Steps involved in it

Step: 1

blur-text-image

Get Instant Access to Expert-Tailored Solutions

See step-by-step solutions with expert insights and AI powered tools for academic success

Step: 2

blur-text-image_2

Step: 3

blur-text-image_3

Ace Your Homework with AI

Get the answers you need in no time with our AI-driven, step-by-step assistance

Get Started

Recommended Textbook for

Mathematics Concepts With Applications

Authors: Charles P McKeague

1st Edition

1630983136, 9781630983130

More Books

Students also viewed these Mathematics questions

Question

Is conflict always unhealthy? Why or why not? (Objective 4)

Answered: 1 week ago