Question: A pension fund manager is considering three mutual funds. The first is a stock fund, the second is a long-term government and corporate bond fund,

A pension fund manager is considering three mutual funds. The first is a stock fund, the second is a long-term government and corporate bond fund, and the third is a T-bill money market fund that yields a rate of 8%. The probability distribution of the risky funds is as follows:
Expected Return Standard Deviation Stock fund (S) Bond fund (B) 20% 30% 
The correlation between these two funds' returns is 10 (i.e., 10%).
a. Tabulate and draw the investment opportunity set of the two risky funds. Use investment proportions for the stock fund of zero to 100% in increments of 20%.
b. What are the investment proportions in the minimum variance portfolio of the two risky funds and what is the expected value and standard deviation of its rate of return
c. Draw a tangent line from the risk-free rate to the opportunity set. What does your graph show for the expected return and standard deviation of the optimal portfolio?
d. Solve numerically for the proportions of each asset and for the expected return and standard deviation of the optimal risky portfolio
e. What is the Sharpe ratio of the best feasible capital allocation line (CAL)?

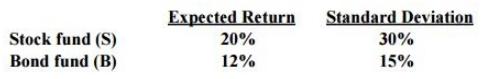
Expected Return Standard Deviation Stock fund (S) Bond fund (B) 20% 30% 12% 15%

Step by Step Solution

3.46 Rating (143 Votes )

There are 3 Steps involved in it

1 Expert Approved Answer
Step: 1 Unlock blur-text-image
Question Has Been Solved by an Expert!

Get step-by-step solutions from verified subject matter experts

Step: 2 Unlock
Step: 3 Unlock

Students Have Also Explored These Related Finance Questions!