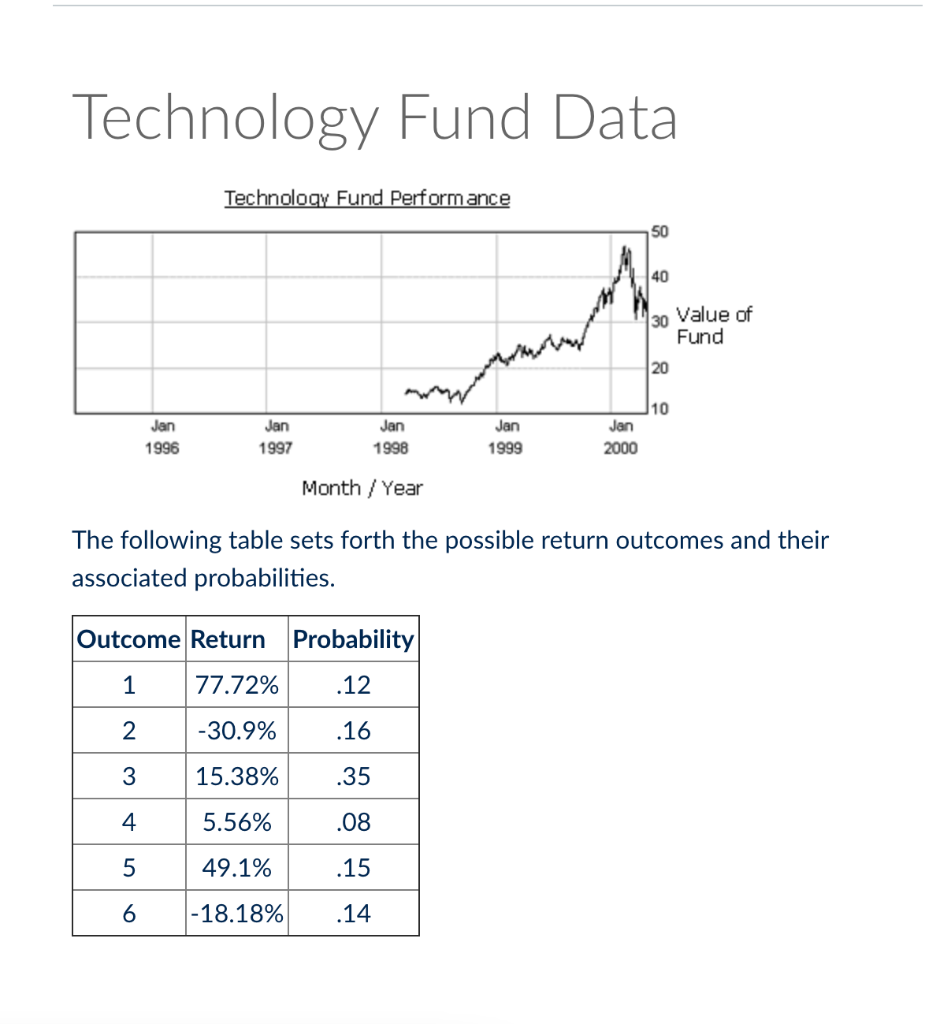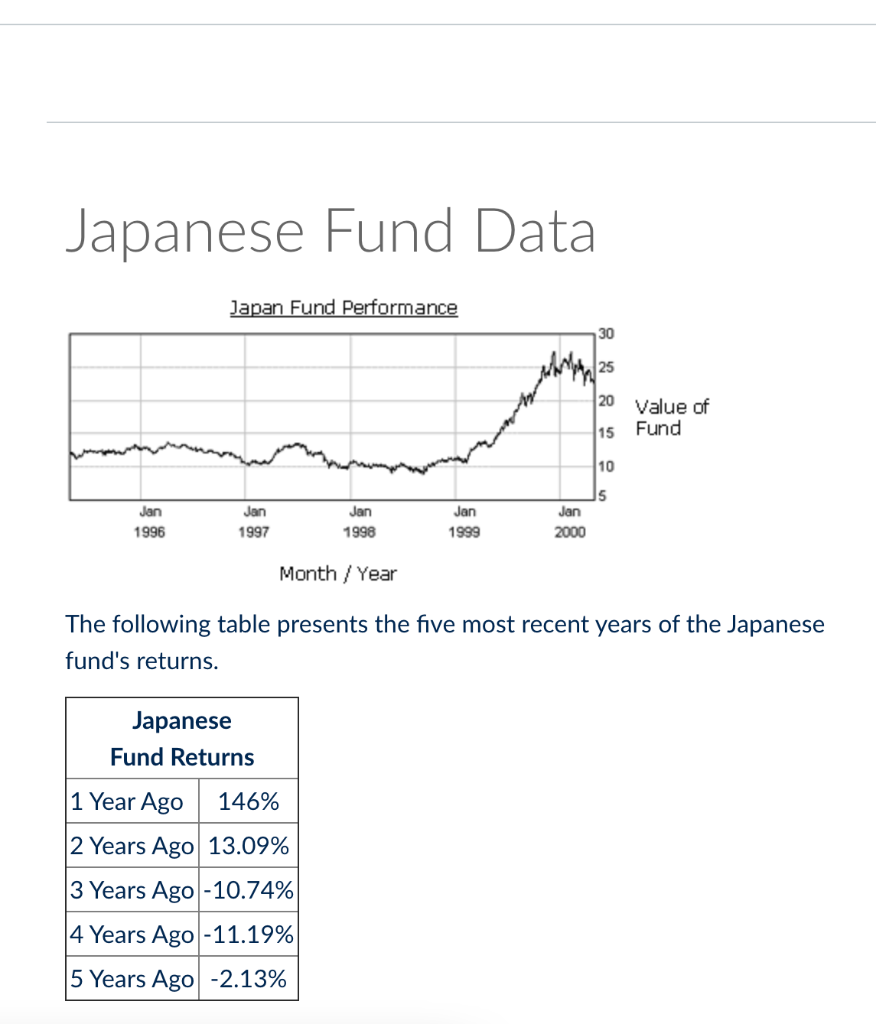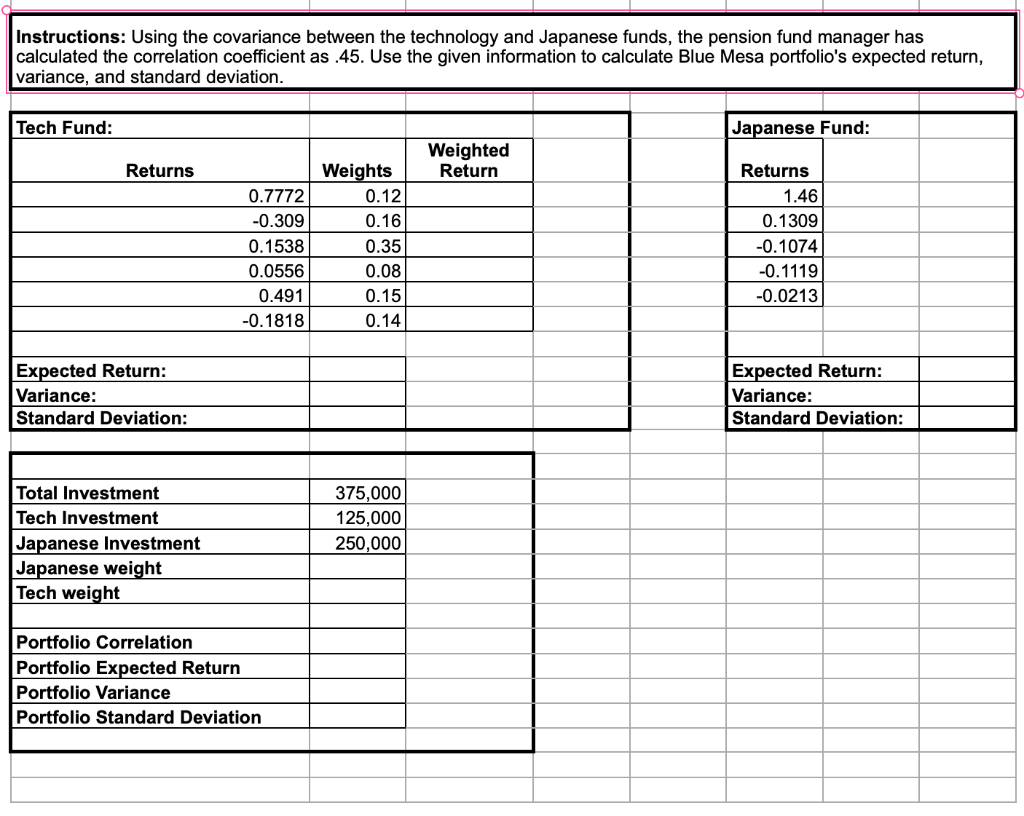


Pension Fund Data Blue Mesa's Pension fund has decided to reduce its exposure to Blue Mesa stock and move all its holdings into mutual funds. Knowing full well the benefits of diversification, the company has chosen to buy two mutual funds. The first fund is a fairly new technology fund that normally invests at least 80 percent of assets in companies that have or will develop products, processes, or services that will provide or benefit from technological advances and improvements. The second fund is a seasoned foreign investment fund that seeks long- term capital appreciation. The fund normally invests at least 65 percent of assets in Japanese debt and equity securities. The pension fund manager has recommended Blue Mesa invest about one-third of its holdings in the technology fund and the remaining two-thirds in the Japanese fund. Because the pension fund managers have only limited information on the past performance of the technology fund, Blue Mesa's analysts have developed a set of possible outcomes based on the past performance of similar technology funds. Conversely, the pension fund manager has plenty of past performance data on the Japanese fund. The Japanese Fund Data chart (also provided in Materials) indicates that the Japanese fund was fairly flat throughout most of the last five years but has appreciated over the most recent year. The pension fund manager is confident that the long-term capital appreciation approach used by the Japanese fund manager will result in solid gains over time. To project the expected return for the Japanese fund, the fund manager has elected to extrapolate its past performance into the future. Technology Fund Data Technology Fund Performance 50 40 30 Value of Fund 20 10 Jan 1996 Jan 1997 Jan 1998 Jan 1999 Jan 2000 Month / Year The following table sets forth the possible return outcomes and their associated probabilities. Outcome Return Probability 1 77.72% .12 2 -30.9% .16 3 15.38% .35 4 5.56% .08 5 49.1% .15 6 - 18.18% .14 Japanese Fund Data Japan Fund Performance 30 25 20 Value of Fund 15 10 5 Jan Jan Jan 1996 Jan 1998 Jan 2000 1997 1999 Month/Year The following table presents the five most recent years of the Japanese fund's returns. Japanese Fund Returns 1 Year Ago 146% 2 Years Ago 13.09% 3 Years Ago -10.74% 4 Years Ago -11.19% 5 Years Ago -2.13% Instructions: Using the covariance between the technology and Japanese funds, the pension fund manager has calculated the correlation coefficient as .45. Use the given information to calculate Blue Mesa portfolio's expected return, variance, and standard deviation. Tech Fund: Japanese Fund: Weighted Return Returns 0.7772 -0.309 0.1538 0.0556 0.491 -0.1818 Weights 0.12 0.16 0.35 0.08 0.15 0.14 Returns 1.46 0.1309 -0.1074 -0.1119 -0.0213 Expected Return: Variance: Standard Deviation: Expected Return: Variance: Standard Deviation: Total Investment Tech Investment Japanese Investment Japanese weight Tech weight 375,000 125,000 250,000 Portfolio Correlation Portfolio Expected Return Portfolio Variance Portfolio Standard Deviation Pension Fund Data Blue Mesa's Pension fund has decided to reduce its exposure to Blue Mesa stock and move all its holdings into mutual funds. Knowing full well the benefits of diversification, the company has chosen to buy two mutual funds. The first fund is a fairly new technology fund that normally invests at least 80 percent of assets in companies that have or will develop products, processes, or services that will provide or benefit from technological advances and improvements. The second fund is a seasoned foreign investment fund that seeks long- term capital appreciation. The fund normally invests at least 65 percent of assets in Japanese debt and equity securities. The pension fund manager has recommended Blue Mesa invest about one-third of its holdings in the technology fund and the remaining two-thirds in the Japanese fund. Because the pension fund managers have only limited information on the past performance of the technology fund, Blue Mesa's analysts have developed a set of possible outcomes based on the past performance of similar technology funds. Conversely, the pension fund manager has plenty of past performance data on the Japanese fund. The Japanese Fund Data chart (also provided in Materials) indicates that the Japanese fund was fairly flat throughout most of the last five years but has appreciated over the most recent year. The pension fund manager is confident that the long-term capital appreciation approach used by the Japanese fund manager will result in solid gains over time. To project the expected return for the Japanese fund, the fund manager has elected to extrapolate its past performance into the future. Technology Fund Data Technology Fund Performance 50 40 30 Value of Fund 20 10 Jan 1996 Jan 1997 Jan 1998 Jan 1999 Jan 2000 Month / Year The following table sets forth the possible return outcomes and their associated probabilities. Outcome Return Probability 1 77.72% .12 2 -30.9% .16 3 15.38% .35 4 5.56% .08 5 49.1% .15 6 - 18.18% .14 Japanese Fund Data Japan Fund Performance 30 25 20 Value of Fund 15 10 5 Jan Jan Jan 1996 Jan 1998 Jan 2000 1997 1999 Month/Year The following table presents the five most recent years of the Japanese fund's returns. Japanese Fund Returns 1 Year Ago 146% 2 Years Ago 13.09% 3 Years Ago -10.74% 4 Years Ago -11.19% 5 Years Ago -2.13% Instructions: Using the covariance between the technology and Japanese funds, the pension fund manager has calculated the correlation coefficient as .45. Use the given information to calculate Blue Mesa portfolio's expected return, variance, and standard deviation. Tech Fund: Japanese Fund: Weighted Return Returns 0.7772 -0.309 0.1538 0.0556 0.491 -0.1818 Weights 0.12 0.16 0.35 0.08 0.15 0.14 Returns 1.46 0.1309 -0.1074 -0.1119 -0.0213 Expected Return: Variance: Standard Deviation: Expected Return: Variance: Standard Deviation: Total Investment Tech Investment Japanese Investment Japanese weight Tech weight 375,000 125,000 250,000 Portfolio Correlation Portfolio Expected Return Portfolio Variance Portfolio Standard Deviation


