Question
A personality psychologist is interested in determining if there is a consistent and predictable relationship between an individual's level of Extraversion (or Introversion) and their
A personality psychologist is interested in determining if there is a consistent and predictable relationship between an individual's level of Extraversion (or Introversion) and their preference for differing locations used to study for their final examinations.
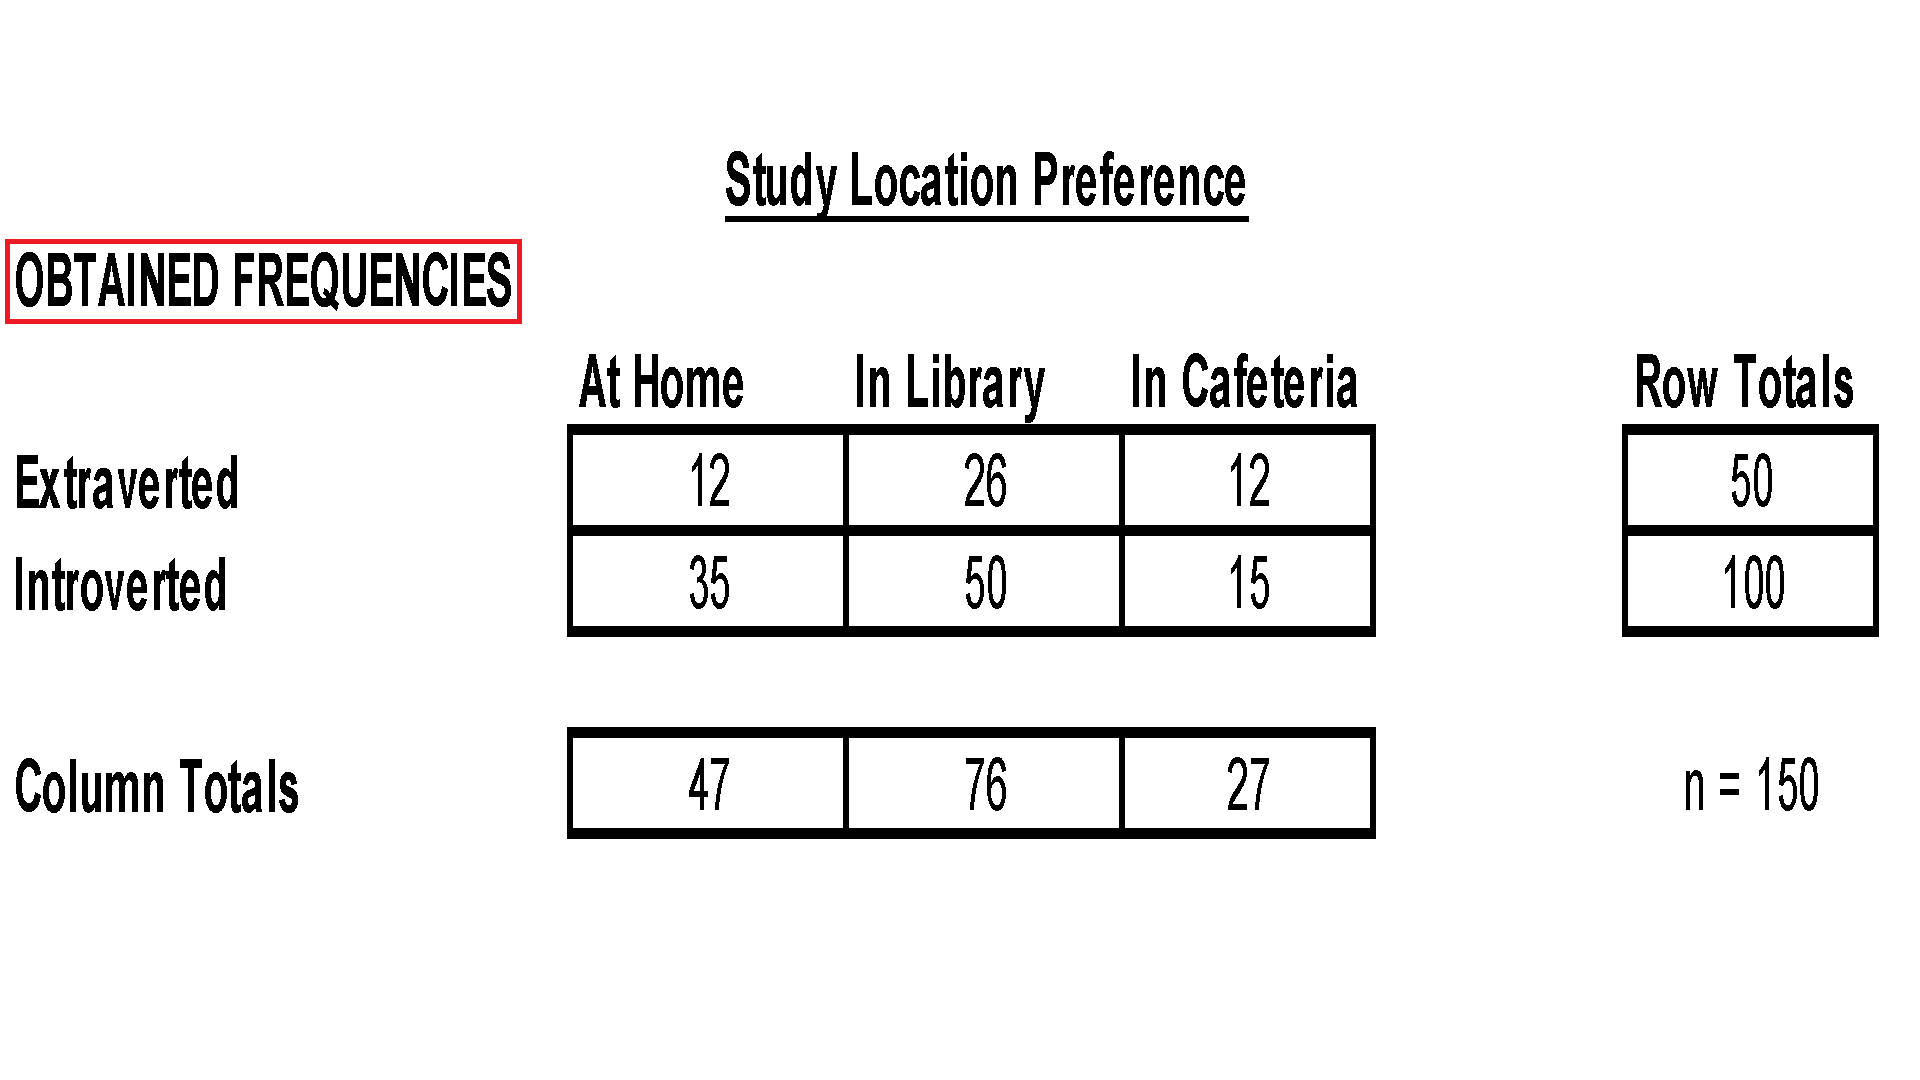
The psychologist selects a random sample of 150 undergraduate psychology majors and evaluates them on their level ofExtraversion/Introversion.It was observed that 50 of the individuals demonstrated a relatively "high" level of extraversion, whereas 100 of the individuals demonstrated a relatively "low" level of extraversion (introverted).Additionally, each of the 150 individuals was asked to report their preferred location for studying for their final examinations out of three available categories (at home, in the library, in the cafeteria).
Based on the above information, choose the correct set of null and alternative hypotheses for this test:
H0:?= 0 H1: ?? 0
H0:??0 H1: ?> 0
H0: ?=0 H1: ?? 0
H0: There is no consistent or predictable relationship between Extraversion/Introversion and Study Location (both are independent of one another). H1: There is a consistent or predictable relationship between Extraversion/Introversion and Study Location (both are dependent on one another).
True/False:The levels ofExtraversion/IntroversionandStudy location Preferencesare the categorical variables of interest to this observational study.
True
False
Based on the above information, answer the following questions below:
QUESTION:Determine the critical region for this test at? (alpha) = .01
Please type aWHOLE number(e.g. 5) as your answer for the blank below.
The degrees of freedom for this hypothesis test is .
Please type anumberrounded to the nearestHUNDREDTHS place (e.g. 2.97)as your answer for the blank below.
The value of the critical region of this hypothesis test is .
Using thedatatable above and your Null Hypothesis, please answer the following questions below.
Please type anumberrounded to the nearestHUNDREDTHS place (e.g. 2.97)as your answer for the blank below.
The value of the expected frequency(fe)forExtravertspreferring toStudy at Homeis .
The value of the expected frequency(fe)forExtravertspreferring toIn the Libraryis .
The value of the expected frequency(fe)forExtravertspreferring toIn the Cafeteriais .
The value of the expected frequency(fe)forIntrovertspreferring toStudy at Homeis .
The value of the expected frequency(fe)forIntrovertspreferring toIn the Libraryis .
The value of the expected frequency(fe)forIntrovertspreferring toIn the Cafeteriais .
Using thedatatable above and yourExpected Frequencies data, please answer the following questions below.
Please type anumberrounded to the nearestHUNDREDTHS place (e.g. 2.97)as your answer for the blank below.
The value of the Chi-Square test-statistic is .
Based on the the results of your hypothesis, select True or False:
True/False:The researcher should REJECT their Null Hypothesis and state that a significant effect is present.
True
False
QUESTION:Based on the results of this hypothesis test,calculate theCramer'sV.
Please type anumberrounded to the nearestHUNDREDTHS place (e.g. .97)as your answer for the blank below.
The valueCramer's Vis .
Please write TWO short (1-2 sentence) paragraphs below.Make sure to answer BOTH sections for full credit!
1.)Statistical Notation Write-up:
This should be a short paragraph (1-2 sentences)!
Write brief but accurate summary of these data in words, making sure to provide an overall statement as to the relationship between the two measured variables, the population of interest, the type of hypothesis test conducted, the significance, the two variables, as well as the appropriateinferential statistics(in APA format).
2.)Written Interpretation:
This should be a short paragraph (1-2 sentences)!
Write a short, but concise interpretation of these data in your own words! Try to write as effectively as possible. You may include aspects such as: relationship of the results of this study to some real-world phenomenon, limitations of the study (power), and/or what the results of this study suggest to do next (e.g. future directions).

Step by Step Solution
There are 3 Steps involved in it
Step: 1

Get Instant Access to Expert-Tailored Solutions
See step-by-step solutions with expert insights and AI powered tools for academic success
Step: 2

Step: 3

Ace Your Homework with AI
Get the answers you need in no time with our AI-driven, step-by-step assistance
Get Started


