Question
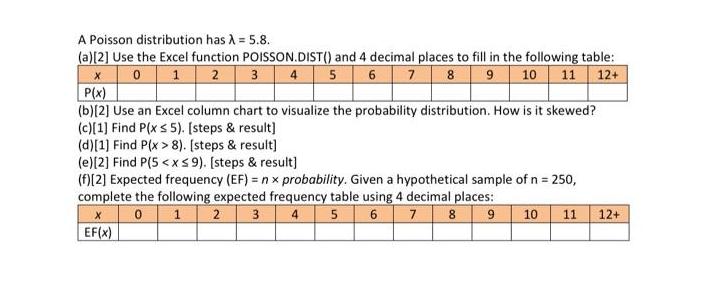
A Poisson distribution has = 5.8. (a)[2] Use the Excel function POISSON.DIST() and 4 decimal places to fill in the following table: 3 4

A Poisson distribution has = 5.8. (a)[2] Use the Excel function POISSON.DIST() and 4 decimal places to fill in the following table: 3 4 5 6 7 8 9 10 11 12+ 0 1 2 X P(x) (b)[2] Use an Excel column chart to visualize the probability distribution. How is it skewed? (c)[1] Find P(x 5). [steps & result] (d)[1] Find P(x > 8). [steps & result] (e)[2] Find P(5 < x9). [steps & result] (f)[2] Expected frequency (EF) = nx probability. Given a hypothetical sample of n = 250, complete the following expected frequency table using 4 decimal places: 0 1 2 3 4 5 6 7 8 9 10 11 12+ X EF(x)
Step by Step Solution
3.43 Rating (156 Votes )
There are 3 Steps involved in it
Step: 1
a Using the POISSONDIST function in Excel with 58 and x values from 0 to 12 we ge...
Get Instant Access to Expert-Tailored Solutions
See step-by-step solutions with expert insights and AI powered tools for academic success
Step: 2

Step: 3

Ace Your Homework with AI
Get the answers you need in no time with our AI-driven, step-by-step assistance
Get StartedRecommended Textbook for
Introduction To Statistical Investigations
Authors: Beth L.Chance, George W.Cobb, Allan J.Rossman Nathan Tintle, Todd Swanson Soma Roy
1st Edition
1118172140, 978-1118172148
Students also viewed these Accounting questions
Question
Answered: 1 week ago
Question
Answered: 1 week ago
Question
Answered: 1 week ago
Question
Answered: 1 week ago
Question
Answered: 1 week ago
Question
Answered: 1 week ago
Question
Answered: 1 week ago
Question
Answered: 1 week ago
Question
Answered: 1 week ago
Question
Answered: 1 week ago
Question
Answered: 1 week ago
Question
Answered: 1 week ago
Question
Answered: 1 week ago
Question
Answered: 1 week ago
Question
Answered: 1 week ago
Question
Answered: 1 week ago
Question
Answered: 1 week ago
Question
Answered: 1 week ago
Question
Answered: 1 week ago
Question
Answered: 1 week ago
Question
Answered: 1 week ago
Question
Answered: 1 week ago
Question
Answered: 1 week ago
View Answer in SolutionInn App


