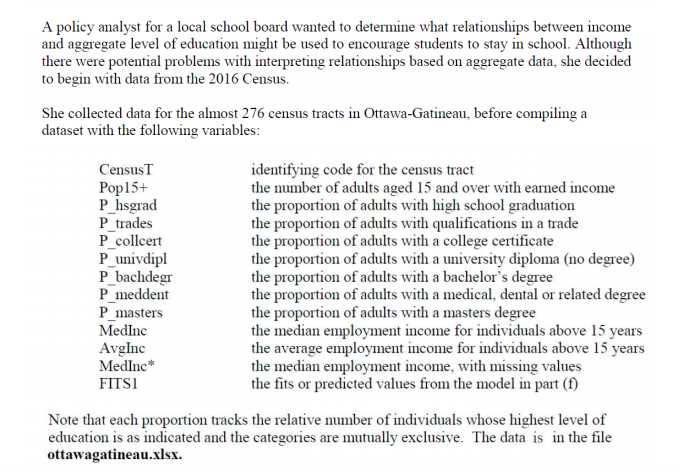
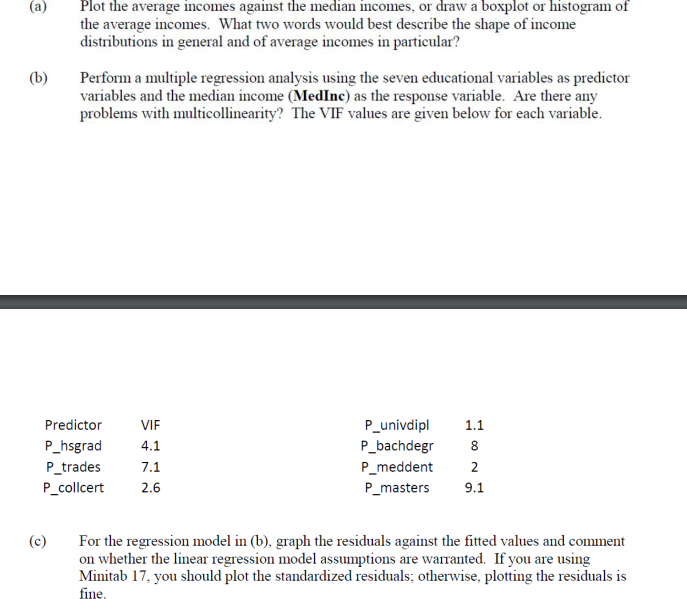
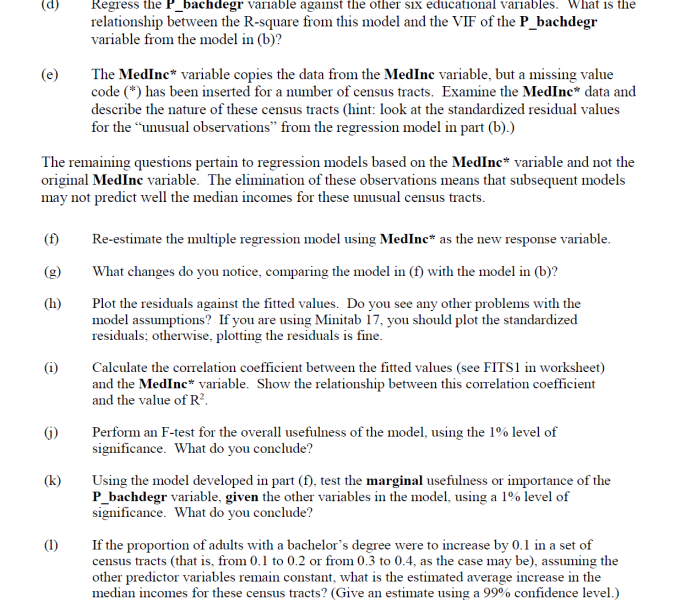
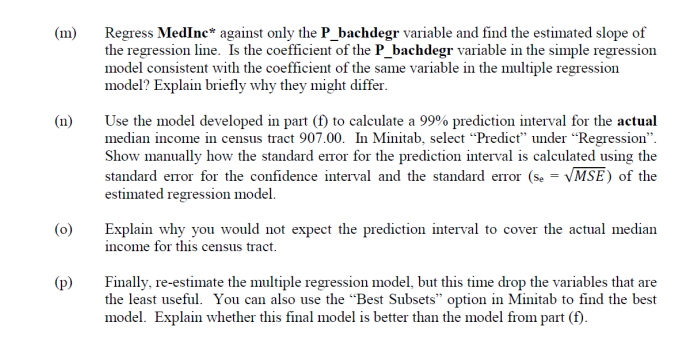
A policy analyst for a local school board wanted to determine what relationships between income and aggregate level of education might be used to encourage students to stay in school. Although there were potential problems with interpreting relationships based on aggregate data, she decided to begin with data from the 2016 Census. She collected data for the almost 276 census tracts in Ottawa-Gatineau, before compiling a dataset with the following variables: CensusT identifying code for the census tract Pop15+ the number of adults aged 15 and over with earned income P hsgrad the proportion of adults with high school graduation P trades the proportion of adults with qualifications in a trade P collcert the proportion of adults with a college certificate P univdipl the proportion of adults with a university diploma (no degree) P bachdegr the proportion of adults with a bachelor's degree P meddent the proportion of adults with a medical, dental or related degree P masters the proportion of adults with a masters degree MedInc the median employment income for individuals above 15 years AvgInc the average employment income for individuals above 15 years MedInc* the median employment income, with missing values FITSI the fits or predicted values from the model in part (f) Note that each proportion tracks the relative number of individuals whose highest level of education is as indicated and the categories are mutually exclusive. The data is in the file ottawagatineau.xlsx.(a) Plot the average incomes against the median incomes, or draw a boxplot or histogram of the average incomes. What two words would best describe the shape of income distributions in general and of average incomes in particular? (b) Perform a multiple regression analysis using the seven educational variables as predictor variables and the median income (MedInc) as the response variable. Are there any problems with multicollinearity? The VIF values are given below for each variable. Predictor VIF P_univdipl 1.1 P_hsgrad 4.1 P_bachdegr 8 P_trades 7.1 P_meddent 2 P_collcert 2.6 P_masters 9.1 (c) For the regression model in (b), graph the residuals against the fitted values and comment on whether the linear regression model assumptions are warranted. If you are using Minitab 17, you should plot the standardized residuals; otherwise, plotting the residuals is fine.(a) Regress the P_bachdegr variable against the other six educational variables. What is the relationship between the R-square from this model and the VIF of the P_bachdegr variable from the model in (b)? (e) The MedInc* variable copies the data from the MedInc variable, but a missing value code (*) has been inserted for a number of census tracts. Examine the MedInc* data and describe the nature of these census tracts (hint: look at the standardized residual values for the "unusual observations" from the regression model in part (b).) The remaining questions pertain to regression models based on the MedInc* variable and not the original MedInc variable. The elimination of these observations means that subsequent models may not predict well the median incomes for these unusual census tracts. (f) Re-estimate the multiple regression model using MedInc* as the new response variable. (g) What changes do you notice, comparing the model in (f) with the model in (b)? (h) Plot the residuals against the fitted values. Do you see any other problems with the model assumptions? If you are using Minitab 17, you should plot the standardized residuals: otherwise, plotting the residuals is fine. (i) Calculate the correlation coefficient between the fitted values (see FITS] in worksheet) and the MedInc* variable. Show the relationship between this correlation coefficient and the value of R. (i) Perform an F-test for the overall usefulness of the model, using the 1% level of significance. What do you conclude? (k) Using the model developed in part (f), test the marginal usefulness or importance of the P_bachdegr variable, given the other variables in the model, using a 1% level of significance. What do you conclude? (1) If the proportion of adults with a bachelor's degree were to increase by 0.1 in a set of census tracts (that is, from 0.1 to 0.2 or from 0.3 to 0.4, as the case may be), assuming the other predictor variables remain constant, what is the estimated average increase in the median incomes for these census tracts? (Give an estimate using a 99% confidence level.)(m) Regress MedInc* against only the P_bachdegr variable and find the estimated slope of the regression line. Is the coefficient of the P_bachdegr variable in the simple regression model consistent with the coefficient of the same variable in the multiple regression model? Explain briefly why they might differ. (n) Use the model developed in part (f) to calculate a 99% prediction interval for the actual median income in census tract 907.00. In Minitab, select "Predict" under "Regression". Show manually how the standard error for the prediction interval is calculated using the standard error for the confidence interval and the standard error (se = VMSE) of the estimated regression model. (0) Explain why you would not expect the prediction interval to cover the actual median income for this census tract. (p) Finally, re-estimate the multiple regression model, but this time drop the variables that are the least useful. You can also use the "Best Subsets" option in Minitab to find the best model. Explain whether this final model is better than the model from part (f)