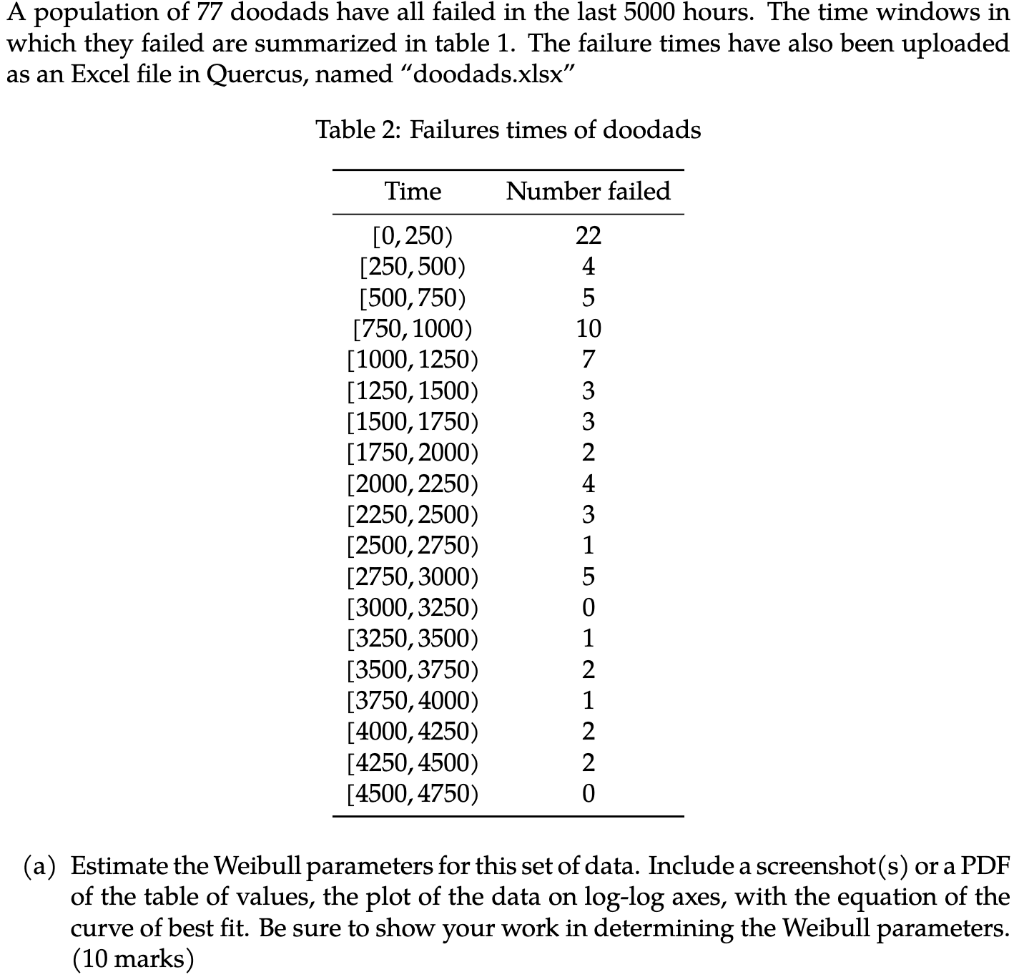
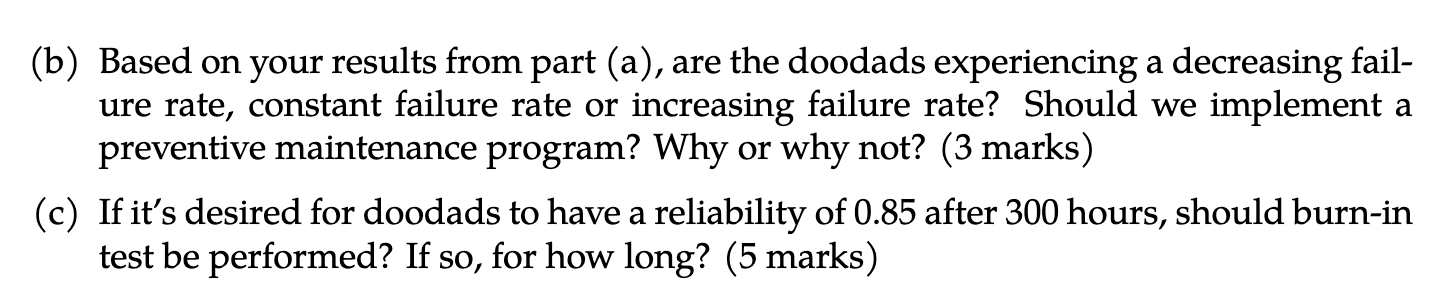
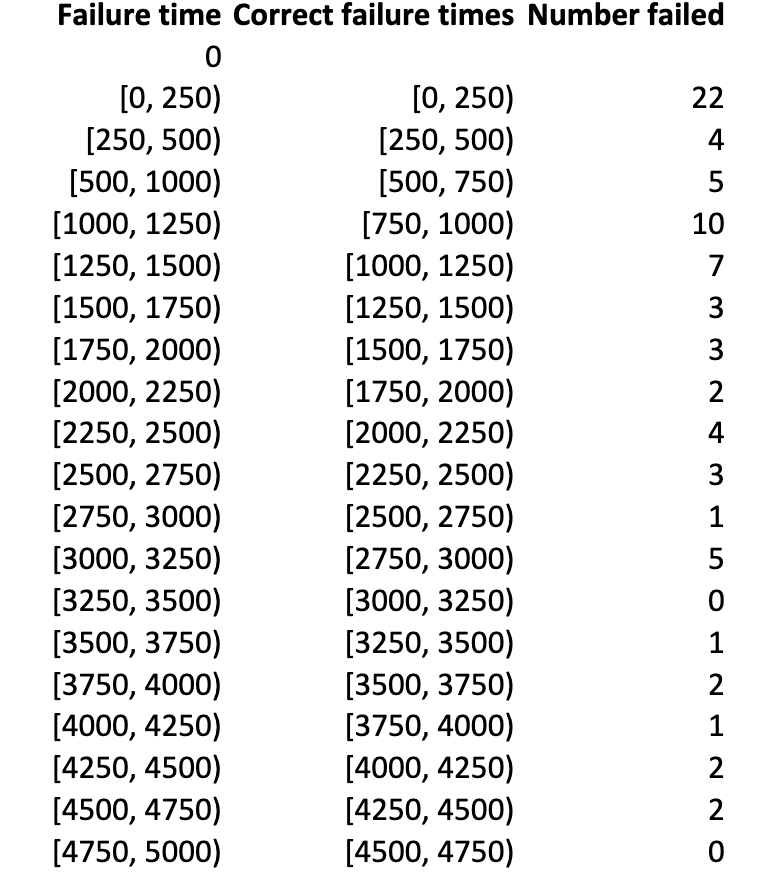
A population of 77 doodads have all failed in the last 5000 hours. The time windows in which they failed are summarized in table 1. The failure times have also been uploaded as an Excel file in Quercus, named "doodads.xlsx" Table 2: Failures times of doodads Time Number failed [0,250) [250,500) [500, 750) [750, 1000) [1000, 1250) [1250, 1500) [1500, 1750) [1750, 2000) [2000, 2250) [2250, 2500) [2500, 2750) [2750,3000) [3000, 3250) [3250, 3500) [3500,3750) [3750,4000) [4000, 4250) [4250, 4500) [4500, 4750) 22 4 5 10 7 3 3 2 4 3 1 5 0 1 2 1 2 2 0 (a) Estimate the Weibull parameters for this set of data. Include a screenshot(s) or a PDF of the table of values, the plot of the data on log-log axes, with the equation of the curve of best fit. Be sure to show your work in determining the Weibull parameters. (10 marks) (b) Based on your results from part (a), are the doodads experiencing a decreasing fail- ure rate, constant failure rate or increasing failure rate? Should we implement a preventive maintenance program? Why or why not? (3 marks) (c) If it's desired for doodads to have a reliability of 0.85 after 300 hours, should burn-in test be performed? If so, for how long? (5 marks) Failure time Correct failure times Number failed 0 [0, 250) [0, 250) 22 [250, 500) [250, 500) 4 [500, 1000) [500, 750) 5 [1000, 1250) [750, 1000) 10 [1250, 1500) [1000, 1250) 7 (1500, 1750) [1250, 1500) 3 (1750, 2000) (1500, 1750) 3 [2000, 2250) [1750, 2000) 2 [2250, 2500) [2000, 2250) 4. [2500, 2750) [2250, 2500) 3 [2750, 3000) [2500, 2750) 1 [3000, 3250) [2750, 3000) 5 [3250, 3500) [3000, 3250) [3500, 3750) [3250, 3500) 1 [3750, 4000) [3500, 3750) 2 [4000, 4250) [3750, 4000) 1 [4250, 4500) [4000, 4250) 2 [4500, 4750) [4250, 4500) 2 [4750, 5000) [4500, 4750) Namn + m - O N N N O A population of 77 doodads have all failed in the last 5000 hours. The time windows in which they failed are summarized in table 1. The failure times have also been uploaded as an Excel file in Quercus, named "doodads.xlsx" Table 2: Failures times of doodads Time Number failed [0,250) [250,500) [500, 750) [750, 1000) [1000, 1250) [1250, 1500) [1500, 1750) [1750, 2000) [2000, 2250) [2250, 2500) [2500, 2750) [2750,3000) [3000, 3250) [3250, 3500) [3500,3750) [3750,4000) [4000, 4250) [4250, 4500) [4500, 4750) 22 4 5 10 7 3 3 2 4 3 1 5 0 1 2 1 2 2 0 (a) Estimate the Weibull parameters for this set of data. Include a screenshot(s) or a PDF of the table of values, the plot of the data on log-log axes, with the equation of the curve of best fit. Be sure to show your work in determining the Weibull parameters. (10 marks) (b) Based on your results from part (a), are the doodads experiencing a decreasing fail- ure rate, constant failure rate or increasing failure rate? Should we implement a preventive maintenance program? Why or why not? (3 marks) (c) If it's desired for doodads to have a reliability of 0.85 after 300 hours, should burn-in test be performed? If so, for how long? (5 marks) Failure time Correct failure times Number failed 0 [0, 250) [0, 250) 22 [250, 500) [250, 500) 4 [500, 1000) [500, 750) 5 [1000, 1250) [750, 1000) 10 [1250, 1500) [1000, 1250) 7 (1500, 1750) [1250, 1500) 3 (1750, 2000) (1500, 1750) 3 [2000, 2250) [1750, 2000) 2 [2250, 2500) [2000, 2250) 4. [2500, 2750) [2250, 2500) 3 [2750, 3000) [2500, 2750) 1 [3000, 3250) [2750, 3000) 5 [3250, 3500) [3000, 3250) [3500, 3750) [3250, 3500) 1 [3750, 4000) [3500, 3750) 2 [4000, 4250) [3750, 4000) 1 [4250, 4500) [4000, 4250) 2 [4500, 4750) [4250, 4500) 2 [4750, 5000) [4500, 4750) Namn + m - O N N N O