Question
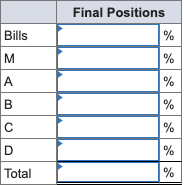
A portfolio manager summarizes the input from the macro and micro forecasters in the following table: A. Already completed B. Compute the proportion in the
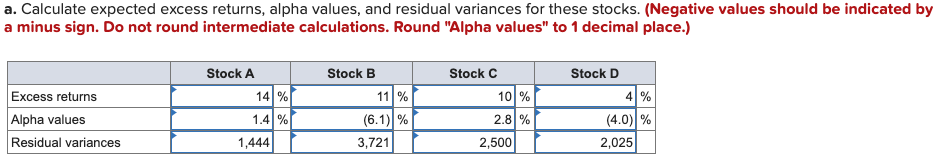
A portfolio manager summarizes the input from the macro and micro forecasters in the following table: 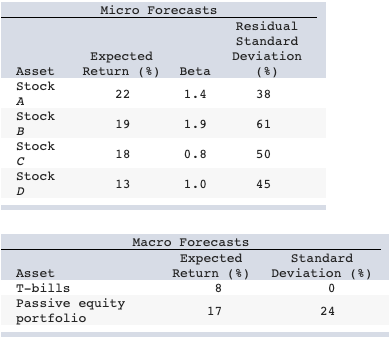
A. Already completed
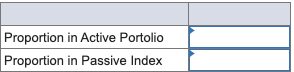
B. Compute the proportion in the active portfolio and the passive index. (Negative values should be indicated by a minus sign. Do not round intermediate calculations. Enter your answer as decimals rounded to 4 places.)
C. What is the Sharpe ratio for the optimal portfolio?
D. By how much did the position in the active portfolio improve the Sharpe ratio compared to a purely passive index strategy?
E. What should be the exact makeup of the complete portfolio (including the risk-free asset) for an investor with a coefficient of risk aversion of 3.0?
Step by Step Solution
There are 3 Steps involved in it
Step: 1

Get Instant Access to Expert-Tailored Solutions
See step-by-step solutions with expert insights and AI powered tools for academic success
Step: 2

Step: 3
Ace Your Homework with AI
Get the answers you need in no time with our AI-driven, step-by-step assistance
Get Started