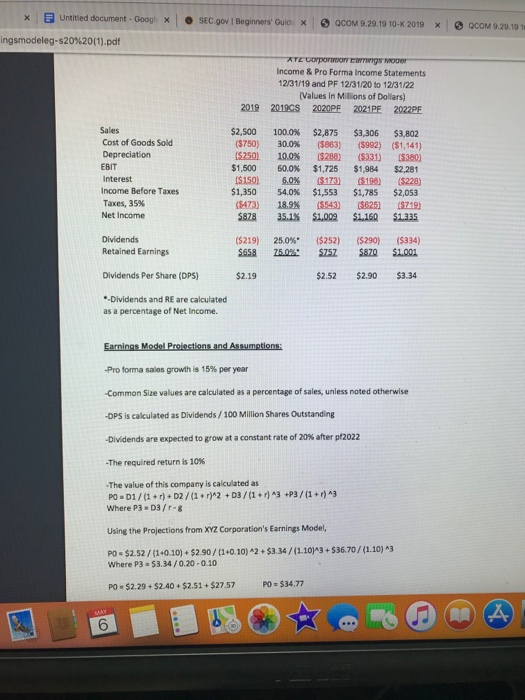
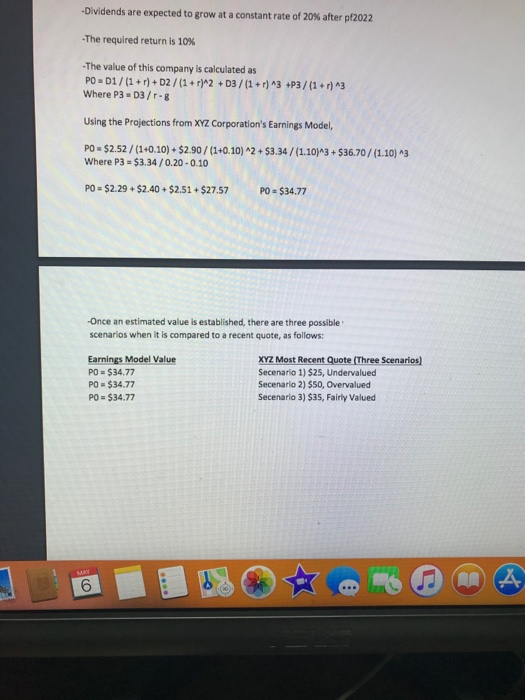
A pro forma Income Statement must be prepared in MS Excel, using a minimum projection of three years, as based on pro forma projections discussed in Chapter 18. You need to include the most recent income statement for your company that is part of the 10-K. This information can then be used to calculate the fair value of the companys stock price, as based on the stock valuation formulas discussed in Chapters 7 and 20. All assumptions and formulas used for the pro forma projections and the companys fair value must be included at the end of your model. Once a fair value is reached, this can be compared to a recent quote of the companys stock price to determine whether or not the company is fairly valued at its most recent trading price. A separate attachment provides an example of how this should be constructed.
This is an example of how it should be done:
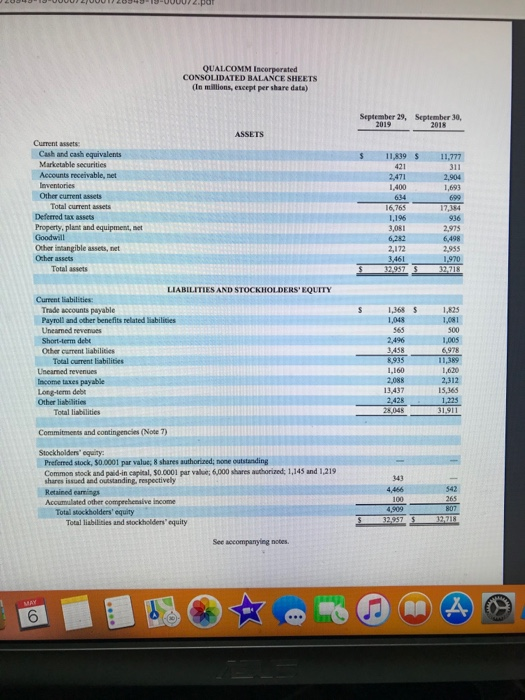
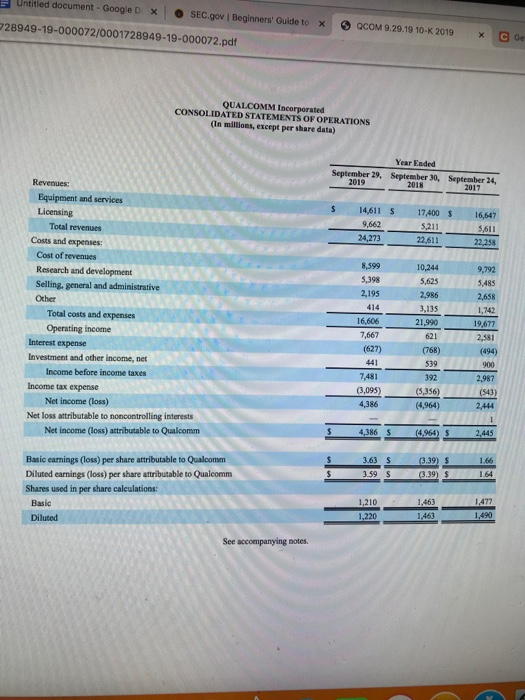
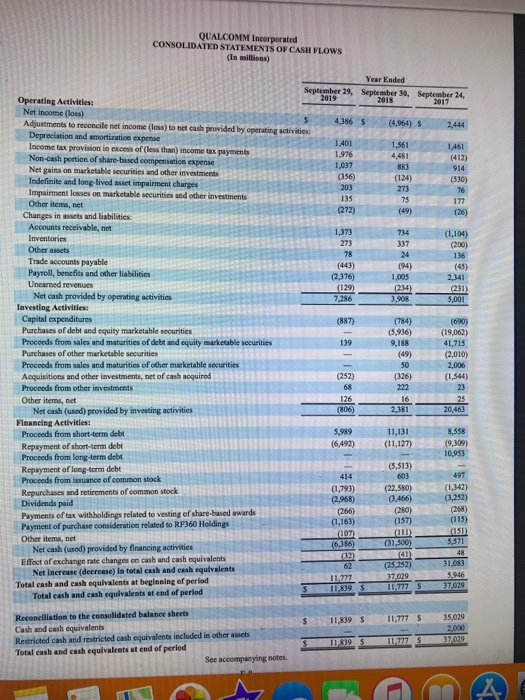
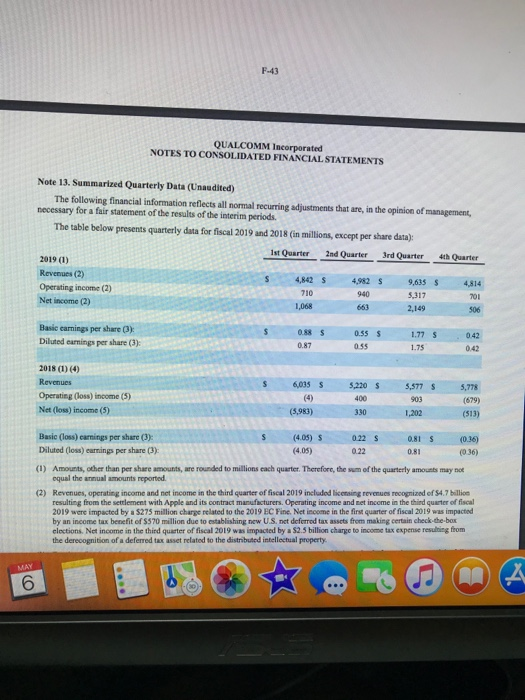
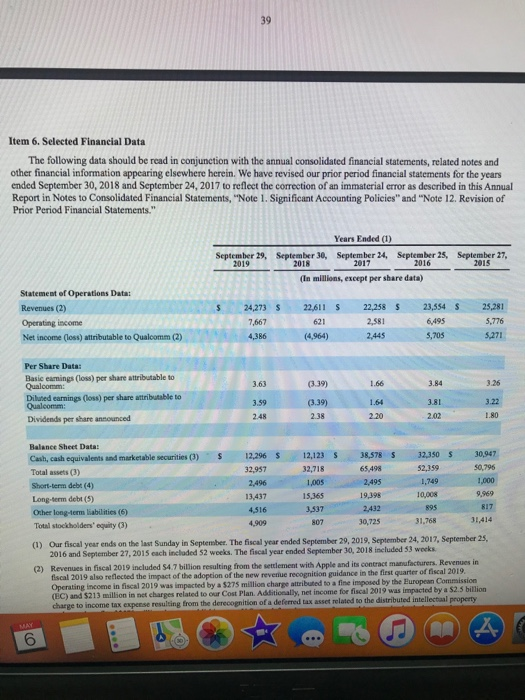
And these are all the financial statements of the company to be used for the Pro Forma:
Untitled document - GooglX SEC.gov Beginners Guide x GCOM 9.20.19 10-K 2019 X O COM 9.20.10 ingsmodeleg-s20%20(1).pdf ATC por Eurocer Income & Pro Forma Income Statements 12/31/19 and PF 12/31/20 to 12/31/22 (Values in Millions of Dollars) 2019 2020PF 2021PE 2022PF 2019 Sales Cost of Goods Sold Depreciation EBIT Interest Income Before Taxes Taxes, 35% Net Income $2,500 ($750) $250) $1,500 I$150) $1,350 ($473) $878 100.0% 30.0% 10.0% 60.0% 6.0% 54.0% 18.9% 35.1% $2,875 ($863) ($288) $1,725 ($173) $1,553 (5543) $1.009 $3,306 ($992) ($331) $1,984 ($198) $1,785 ($625) $1,160 $3,802 ($1,141) $3.80) $2,281 ($228) $2,053 9719) $1,335 Dividends Retained Earnings ($219) $658 25.0% 75.0% $252) $757 ($290) $870 ($334) $1.001 Dividends Per Share (DPS) $2.19 $2.52 $2.90 $3.34 *Dividends and RE are calculated as a percentage of Net Income. Earnings Model Protections and Assumptions: -Pro forma sales growth is 15% per year -Common Size values are calculated as a percentage of sales, unless noted otherwise -DPS is calculated as Dividends / 100 Million Shares Outstanding -Dividends are expected to grow at a constant rate of 20% after pf2022 -The required return is 10% -The value of this company is calculated as PO - 01/(1+r) + D2 / (1+r)^2 + D3 / (1+r)^3 +P3 / (1+r)^3 Where P3D3/r- Using the Projections from XYZ Corporation's Earnings Model, PO - $2.52/(1+0.10) + $2.90/(1+0.10) 2 + $3.34/(1.10)^3 +$36.70/(1.10) 3 Where P3 - $3.34 / 0.20 -0.10 PO - $2.29 $2.40 $2.51 + $27.57 PO - $34.77 -Dividends are expected to grow at a constant rate of 20% after pf2022 -The required return is 10% -The value of this company is calculated as PO - 01/(1 + r) + D2/(1+r)^2 +D3 / (1+r)^3 +P3/(1+r)^3 Where P3 =D3/r-g Using the Projections from XYZ Corporation's Earnings Model, PO - $2.52/(1+0.10) + $2.90/(1+0.10)^2 + $3.34/(1.10)^3 + $36.70/(1.10) 3 Where P3 = $3.34/0.20 -0.10 PO = $2.29 + $2.40 + $2.51 $27.57 PO = $34.77 Once an estimated value is established, there are three possible scenarios when it is compared to a recent quote, as follows: Earnings Model Value PO = $34.77 PO = $34.77 PO = $34.77 XYZ Most Recent Quote (Three Scenarios) Secenario 1) $25, Undervalued Secenario 2) $50, Overvalued Secenario 3) $35, Fairly Valued JU U UUUJ 2/UUUW20943 19-U0002.por QUALCOMM Incorporated CONSOLIDATED BALANCE SHEETS (En milions, except per share data) September 29, September 30, 2018 11,819 $ 11.777 2.471 1.400 2,904 1,693 Current assets Cash and cash equivalents Marketable securities Accounts receivable, met Inventories Other current assets Total current assets Deferred tax assets Property, plant and equipment, met Goodwill Other intangible assets, net Other assets Total assets 16,765 1.196 2,975 2,172 2.955 1,970 32,718 1220575 1.048 LIABILITIES AND STOCKHOLDERS' EQUITY Current liabilities: Trade accounts payable Payroll and other benefits related liabilities Uneamed revenues Short-term debt Other current liabilities Total current abilities Uneamed revenues Income taxes payable Lorem debt 2,496 8935 1.620 2,312 1,160 2,088 13,437 2.428 25,048 1.235 Total liabilities 31,911 Commitments and contingencies (Note 7) Stockholders' equity Preferred stock, 50.0001 par value: 8 shares authorized: none outstanding Common stock and paid in capital, $0.0001 par value; 6,000 shares authorized: 1,145 and 1,219 shares issued and outstanding respectively Retained earnings Accumulated other compeehensive income Total stockholders' equity Total liabilities and stockholders' equity 32957 12218 Untitled document - Google DX O SEC.govi Beginners' Guide to * 28949-19-000072/0001728949-19-000072.pdf QCOM 9.29.19 10-K 2019 x Co QUALCOMM Incorporated CONSOLIDATED STATEMENTS OF OPERATIONS (a millions, except per share data) Year Ended September 29, September 30, September 24, 2017 2018 $ S 17 400 $ 16.647 14,611 9,662 24,273 5,211 5611 22.611 22,258 9,792 5.485 2,658 Revenues: Equipment and services Licensing Total revenues Costs and expenses: Cost of revenues Research and development Selling general and administrative Other Total costs and expenses Operating income Interest expense Investment and other income, net Income before income taxes Income tax expense Net income (Loss) Net loss attributable to noncontrolling interests Net income (loss) attributable to Qualcomm 8,599 5.398 2,195 414 16,606 7,667 (627) 441 7,481 3,095) 4,386 10,244 5,625 2.986 3,135 21.990 621 (768) 539 19,677 2,581 (494) 392 (50) (5,356) (4,964) 2.444 $ 4,386 S (4,964) S 2 ,445 3.63 $ 0.39 S 3.39) S 1.66 1.64 3.595 Basic earnings (loss) per share attributable to Qualcomm Diluted earnings (loss) per share attributable to Qualcomm Shares used in per share calculations: Basic 1,210 1.463 Diluted See accompanying notes 1,401 1.561 136 QUALCOMM Incorporated CONSOLIDATED STATEMENTS OF CASH FLOWS (in millions) Year Ended September 29, September 30, September 24, Operating Activities 2018 Net income (loss) Adjustments to reconcile net income (los) to net cash provided by cperating activities 4386 $ (4.964) S Depreciation and amortization expense Income tax provision in excess of (less than) income tax payments 1.451 1,976 Non-cash portion of share-based compensation expense (412) 1.037 883 Net gains on marketable securities and other investments (356) Indefinite and long-lived asset impairment charges (124) (530) 203 273 Impairment losses on marketable securities and other investments 75 177 Other items, net (272) (49) (26) Changes in assets and liabilities Accounts receivable, net 1,373 734 (1,104) Inventories 273 0001 Other assets 24 Trade accounts payable (443) (94) (45) Payroll, benefits and other liabilities (2,376) 1.005 2.341 Unearned revenues (129) (234) (231) Net cash provided by operating activities 7.286 3.908 5,001 Investing Activities: Capital expenditures (887) (784) (690) Purchases of debt and equity marketable securities (5,936) (19,062) Proceeds from sales and maturities of debt and equity marketable securities 9,188 41,715 Purchases of other marketable securities (2,010) Proceeds from sales and maturities of other marketable securities 2,006 Acquisitions and other investments, net of cash acquired (252) (326) (1,544) Proceeds from other investments 222 23 Other items, net 16 25 Net cash (used) provided by investing activities (806) 2,381 20,463 Financing Activities: Proceeds from short-term debt 11,131 8,558 Repayment of short-term debt (6,492) (11,127) (9.309) 10,953 Proceeds from long-term debt (5,513) Repayment of long-term debt 414 Proceeds from issuance of common stock (1,793) (22,580) (1,342) Repurchases and retirements of common stock (2,968) (466) Dividends paid (3.252) (280) (268) Payments of tax with holdings related to vesting of share-based awards (1,163) (157) (115) Payment of purchase consideration related to RF360 Holdings (107) (110 (151) Other items, net (6,386) (31.500) 5,571 Net cash (used) provided by financing activities (33) (41) Effect of exchange rate changes en cash and cash equivalents (25.252) 31.083 Net Increase (decrease) in total cash and cash equivalents 37029 5.946 Total cash and cash equivalents at beginning of period $ $ 11.777 S 37,029 Total cash and cash equivalents at end of period 139 (49) 50 68 126 5.989 603 (266) 11.777 11,839 $ 11,839 $ 11,777 $ 35,029 2.000 Reconciliation to the consolidated balance sheets Cash and cash equivalents Restricted cash and restricted cash equivalents included in other assets Total cash and cash equivalents at end of period See accompanying notes. $ 11,839 S 11,777 S nuomon F-41 QUALCOMM Incorporated NOTES TO CONSOLIDATED FINANCIAL STATEMENTS Note 13. Summarired Quarterly Data (Unedited) The following financial information reflects all normal recurring adjustments that are in the opinion of management necessary for a fair statement of the results of the interim periods. The table below presents quarterly data for fiscal 2019 and 2018 (in millions, except per share data) 1st Quarter 2nd Quarter 3rd Quarter 4th Quarter 2019 (1) Revenues (2) 4,862 s 4,982 s 9,635 s 4,814 Operating income (2) 710 940 Net income (2) 701 1,068 5.317 2,149 Basic earnings per share (3) Diluted camnings per share (3) $ 0.55 $ 0.88 0.87 1775 1.75 6,035 S 2018 (1) (4) Revenues Operating (los) income (5) Net (los) income (5) 5,220 S 5,577 S 400 5,778 (679) (5,983) 330 1,202 (513) 081 Basic (loss) earnings per share (3) (4.05) S 0225 081 S 0.36) Diluted (los) curning per share (3) (4.05) 0.22 0.36) (1) Amounts, other than per share amounts are rounded to millions each quarter. Therefore, the sum of the quarterly amount may not equal the annual amounts reported (2) Revenues, operating income and net income in the third quarter of fiscal 2019 included i n recogid of $4.7 Million resulting from the settlement with Apple and its contract manufacturers. Operating income and set income in the third quarter of fal 2019 were impacted by S275 million charge related to the 2019 EC Fine Net income in the first quarter of fiscal 2019 was impacted by an income tax benefit of 5570 million due to establishing new US.net deferred tax ass from making certain check the box elections. Net income in the thind quarter of fiscal 2019 was impacted by a $25 billion charge to income tax expense resulting from the derecognition of a deferred tax related to the distributed intellectual property Item 6. Selected Financial Data The following data should be read in conjunction with the annual consolidated financial statements, related notes and other financial information appearing elsewhere herein. We have revised our prior period financial statements for the years ended September 30, 2018 and September 24, 2017 to reflect the correction of an immaterial error as described in this Annual Report in Notes to Consolidated Financial Statements, "Note 1. Significant Accounting Policies" and "Note 12. Revision of Prior Period Financial Statements." Years Ended (1) September 29, September 30, September 24, September 25, September 27, (In millions, except per share data) $ $ S $ S Statement of Operations Data: Revenues (2) Operating income Net income (los) attributable to Qualcomm (2) 24,273 7.667 4,386 22,611 62 (4,964) 22,258 2 581 2,445 23,554 6,495 5,705 25,281 5,776 5.271 (339) 3.84 Per Share Data: Basie earnings (loss) per share attributable to Qualcomm Diluted earnings (loss) per share attributable to Qualcomm Dividends per share announced (3.39) 3.59 2.48 895 817 Balance Sheet Data: Cash, cash equivalents and marketable securities (). is metable securities (3) S S 12.296 $ 12,123 S 38,578 S 32,350 $ 30,947 Total assets (3) 32.957 32,718 65,498 52,159 50.795 Short-term debt (4) 2,496 1,005 2,495 1,749 1.000 Long-term debt (5) 13,437 15,365 19,398 10008 9.969 Other long-term liabilities (6) 4,516 3,537 2,432 Total stockholders' equity (3) 4,909 30,725 31.768 (1) Our fiscal year ends on the last Sunday in September. The fiscal year ended September 29, 2019. September 24, 2017 September 25, 2016 and September 27, 2015 each included 52 weeks. The fiscal year ended September 30, 2018 included 53 weeks (2) Revenues in fiscal 2019 included $4.7 billion resulting from the settlement with Apple and its contract manufacturers. Revenues in fiscal 2019 also reflected the impact of the adoption of the new revenue recognition guidance in the first quarter of fiscal 2019. Operating income in fiscal 2019 was impacted by a $275 million charge attributed to a fine imposed by the European Commission (EC) and 5213 million in ne charges related to our Cost Plan. Additionally, net income for fiscal 2019 was impacted by a $2.5 billion charge to income tax expense resulting from the derecognition of a deferred tax asset related to the distributed intellectual property Untitled document - GooglX SEC.gov Beginners Guide x GCOM 9.20.19 10-K 2019 X O COM 9.20.10 ingsmodeleg-s20%20(1).pdf ATC por Eurocer Income & Pro Forma Income Statements 12/31/19 and PF 12/31/20 to 12/31/22 (Values in Millions of Dollars) 2019 2020PF 2021PE 2022PF 2019 Sales Cost of Goods Sold Depreciation EBIT Interest Income Before Taxes Taxes, 35% Net Income $2,500 ($750) $250) $1,500 I$150) $1,350 ($473) $878 100.0% 30.0% 10.0% 60.0% 6.0% 54.0% 18.9% 35.1% $2,875 ($863) ($288) $1,725 ($173) $1,553 (5543) $1.009 $3,306 ($992) ($331) $1,984 ($198) $1,785 ($625) $1,160 $3,802 ($1,141) $3.80) $2,281 ($228) $2,053 9719) $1,335 Dividends Retained Earnings ($219) $658 25.0% 75.0% $252) $757 ($290) $870 ($334) $1.001 Dividends Per Share (DPS) $2.19 $2.52 $2.90 $3.34 *Dividends and RE are calculated as a percentage of Net Income. Earnings Model Protections and Assumptions: -Pro forma sales growth is 15% per year -Common Size values are calculated as a percentage of sales, unless noted otherwise -DPS is calculated as Dividends / 100 Million Shares Outstanding -Dividends are expected to grow at a constant rate of 20% after pf2022 -The required return is 10% -The value of this company is calculated as PO - 01/(1+r) + D2 / (1+r)^2 + D3 / (1+r)^3 +P3 / (1+r)^3 Where P3D3/r- Using the Projections from XYZ Corporation's Earnings Model, PO - $2.52/(1+0.10) + $2.90/(1+0.10) 2 + $3.34/(1.10)^3 +$36.70/(1.10) 3 Where P3 - $3.34 / 0.20 -0.10 PO - $2.29 $2.40 $2.51 + $27.57 PO - $34.77 -Dividends are expected to grow at a constant rate of 20% after pf2022 -The required return is 10% -The value of this company is calculated as PO - 01/(1 + r) + D2/(1+r)^2 +D3 / (1+r)^3 +P3/(1+r)^3 Where P3 =D3/r-g Using the Projections from XYZ Corporation's Earnings Model, PO - $2.52/(1+0.10) + $2.90/(1+0.10)^2 + $3.34/(1.10)^3 + $36.70/(1.10) 3 Where P3 = $3.34/0.20 -0.10 PO = $2.29 + $2.40 + $2.51 $27.57 PO = $34.77 Once an estimated value is established, there are three possible scenarios when it is compared to a recent quote, as follows: Earnings Model Value PO = $34.77 PO = $34.77 PO = $34.77 XYZ Most Recent Quote (Three Scenarios) Secenario 1) $25, Undervalued Secenario 2) $50, Overvalued Secenario 3) $35, Fairly Valued JU U UUUJ 2/UUUW20943 19-U0002.por QUALCOMM Incorporated CONSOLIDATED BALANCE SHEETS (En milions, except per share data) September 29, September 30, 2018 11,819 $ 11.777 2.471 1.400 2,904 1,693 Current assets Cash and cash equivalents Marketable securities Accounts receivable, met Inventories Other current assets Total current assets Deferred tax assets Property, plant and equipment, met Goodwill Other intangible assets, net Other assets Total assets 16,765 1.196 2,975 2,172 2.955 1,970 32,718 1220575 1.048 LIABILITIES AND STOCKHOLDERS' EQUITY Current liabilities: Trade accounts payable Payroll and other benefits related liabilities Uneamed revenues Short-term debt Other current liabilities Total current abilities Uneamed revenues Income taxes payable Lorem debt 2,496 8935 1.620 2,312 1,160 2,088 13,437 2.428 25,048 1.235 Total liabilities 31,911 Commitments and contingencies (Note 7) Stockholders' equity Preferred stock, 50.0001 par value: 8 shares authorized: none outstanding Common stock and paid in capital, $0.0001 par value; 6,000 shares authorized: 1,145 and 1,219 shares issued and outstanding respectively Retained earnings Accumulated other compeehensive income Total stockholders' equity Total liabilities and stockholders' equity 32957 12218 Untitled document - Google DX O SEC.govi Beginners' Guide to * 28949-19-000072/0001728949-19-000072.pdf QCOM 9.29.19 10-K 2019 x Co QUALCOMM Incorporated CONSOLIDATED STATEMENTS OF OPERATIONS (a millions, except per share data) Year Ended September 29, September 30, September 24, 2017 2018 $ S 17 400 $ 16.647 14,611 9,662 24,273 5,211 5611 22.611 22,258 9,792 5.485 2,658 Revenues: Equipment and services Licensing Total revenues Costs and expenses: Cost of revenues Research and development Selling general and administrative Other Total costs and expenses Operating income Interest expense Investment and other income, net Income before income taxes Income tax expense Net income (Loss) Net loss attributable to noncontrolling interests Net income (loss) attributable to Qualcomm 8,599 5.398 2,195 414 16,606 7,667 (627) 441 7,481 3,095) 4,386 10,244 5,625 2.986 3,135 21.990 621 (768) 539 19,677 2,581 (494) 392 (50) (5,356) (4,964) 2.444 $ 4,386 S (4,964) S 2 ,445 3.63 $ 0.39 S 3.39) S 1.66 1.64 3.595 Basic earnings (loss) per share attributable to Qualcomm Diluted earnings (loss) per share attributable to Qualcomm Shares used in per share calculations: Basic 1,210 1.463 Diluted See accompanying notes 1,401 1.561 136 QUALCOMM Incorporated CONSOLIDATED STATEMENTS OF CASH FLOWS (in millions) Year Ended September 29, September 30, September 24, Operating Activities 2018 Net income (loss) Adjustments to reconcile net income (los) to net cash provided by cperating activities 4386 $ (4.964) S Depreciation and amortization expense Income tax provision in excess of (less than) income tax payments 1.451 1,976 Non-cash portion of share-based compensation expense (412) 1.037 883 Net gains on marketable securities and other investments (356) Indefinite and long-lived asset impairment charges (124) (530) 203 273 Impairment losses on marketable securities and other investments 75 177 Other items, net (272) (49) (26) Changes in assets and liabilities Accounts receivable, net 1,373 734 (1,104) Inventories 273 0001 Other assets 24 Trade accounts payable (443) (94) (45) Payroll, benefits and other liabilities (2,376) 1.005 2.341 Unearned revenues (129) (234) (231) Net cash provided by operating activities 7.286 3.908 5,001 Investing Activities: Capital expenditures (887) (784) (690) Purchases of debt and equity marketable securities (5,936) (19,062) Proceeds from sales and maturities of debt and equity marketable securities 9,188 41,715 Purchases of other marketable securities (2,010) Proceeds from sales and maturities of other marketable securities 2,006 Acquisitions and other investments, net of cash acquired (252) (326) (1,544) Proceeds from other investments 222 23 Other items, net 16 25 Net cash (used) provided by investing activities (806) 2,381 20,463 Financing Activities: Proceeds from short-term debt 11,131 8,558 Repayment of short-term debt (6,492) (11,127) (9.309) 10,953 Proceeds from long-term debt (5,513) Repayment of long-term debt 414 Proceeds from issuance of common stock (1,793) (22,580) (1,342) Repurchases and retirements of common stock (2,968) (466) Dividends paid (3.252) (280) (268) Payments of tax with holdings related to vesting of share-based awards (1,163) (157) (115) Payment of purchase consideration related to RF360 Holdings (107) (110 (151) Other items, net (6,386) (31.500) 5,571 Net cash (used) provided by financing activities (33) (41) Effect of exchange rate changes en cash and cash equivalents (25.252) 31.083 Net Increase (decrease) in total cash and cash equivalents 37029 5.946 Total cash and cash equivalents at beginning of period $ $ 11.777 S 37,029 Total cash and cash equivalents at end of period 139 (49) 50 68 126 5.989 603 (266) 11.777 11,839 $ 11,839 $ 11,777 $ 35,029 2.000 Reconciliation to the consolidated balance sheets Cash and cash equivalents Restricted cash and restricted cash equivalents included in other assets Total cash and cash equivalents at end of period See accompanying notes. $ 11,839 S 11,777 S nuomon F-41 QUALCOMM Incorporated NOTES TO CONSOLIDATED FINANCIAL STATEMENTS Note 13. Summarired Quarterly Data (Unedited) The following financial information reflects all normal recurring adjustments that are in the opinion of management necessary for a fair statement of the results of the interim periods. The table below presents quarterly data for fiscal 2019 and 2018 (in millions, except per share data) 1st Quarter 2nd Quarter 3rd Quarter 4th Quarter 2019 (1) Revenues (2) 4,862 s 4,982 s 9,635 s 4,814 Operating income (2) 710 940 Net income (2) 701 1,068 5.317 2,149 Basic earnings per share (3) Diluted camnings per share (3) $ 0.55 $ 0.88 0.87 1775 1.75 6,035 S 2018 (1) (4) Revenues Operating (los) income (5) Net (los) income (5) 5,220 S 5,577 S 400 5,778 (679) (5,983) 330 1,202 (513) 081 Basic (loss) earnings per share (3) (4.05) S 0225 081 S 0.36) Diluted (los) curning per share (3) (4.05) 0.22 0.36) (1) Amounts, other than per share amounts are rounded to millions each quarter. Therefore, the sum of the quarterly amount may not equal the annual amounts reported (2) Revenues, operating income and net income in the third quarter of fiscal 2019 included i n recogid of $4.7 Million resulting from the settlement with Apple and its contract manufacturers. Operating income and set income in the third quarter of fal 2019 were impacted by S275 million charge related to the 2019 EC Fine Net income in the first quarter of fiscal 2019 was impacted by an income tax benefit of 5570 million due to establishing new US.net deferred tax ass from making certain check the box elections. Net income in the thind quarter of fiscal 2019 was impacted by a $25 billion charge to income tax expense resulting from the derecognition of a deferred tax related to the distributed intellectual property Item 6. Selected Financial Data The following data should be read in conjunction with the annual consolidated financial statements, related notes and other financial information appearing elsewhere herein. We have revised our prior period financial statements for the years ended September 30, 2018 and September 24, 2017 to reflect the correction of an immaterial error as described in this Annual Report in Notes to Consolidated Financial Statements, "Note 1. Significant Accounting Policies" and "Note 12. Revision of Prior Period Financial Statements." Years Ended (1) September 29, September 30, September 24, September 25, September 27, (In millions, except per share data) $ $ S $ S Statement of Operations Data: Revenues (2) Operating income Net income (los) attributable to Qualcomm (2) 24,273 7.667 4,386 22,611 62 (4,964) 22,258 2 581 2,445 23,554 6,495 5,705 25,281 5,776 5.271 (339) 3.84 Per Share Data: Basie earnings (loss) per share attributable to Qualcomm Diluted earnings (loss) per share attributable to Qualcomm Dividends per share announced (3.39) 3.59 2.48 895 817 Balance Sheet Data: Cash, cash equivalents and marketable securities (). is metable securities (3) S S 12.296 $ 12,123 S 38,578 S 32,350 $ 30,947 Total assets (3) 32.957 32,718 65,498 52,159 50.795 Short-term debt (4) 2,496 1,005 2,495 1,749 1.000 Long-term debt (5) 13,437 15,365 19,398 10008 9.969 Other long-term liabilities (6) 4,516 3,537 2,432 Total stockholders' equity (3) 4,909 30,725 31.768 (1) Our fiscal year ends on the last Sunday in September. The fiscal year ended September 29, 2019. September 24, 2017 September 25, 2016 and September 27, 2015 each included 52 weeks. The fiscal year ended September 30, 2018 included 53 weeks (2) Revenues in fiscal 2019 included $4.7 billion resulting from the settlement with Apple and its contract manufacturers. Revenues in fiscal 2019 also reflected the impact of the adoption of the new revenue recognition guidance in the first quarter of fiscal 2019. Operating income in fiscal 2019 was impacted by a $275 million charge attributed to a fine imposed by the European Commission (EC) and 5213 million in ne charges related to our Cost Plan. Additionally, net income for fiscal 2019 was impacted by a $2.5 billion charge to income tax expense resulting from the derecognition of a deferred tax asset related to the distributed intellectual property
